by Pinchas Cohen
Will the US equity market and dollar move higher, or will they go down? Global stock markets are at record highs, which suggests a positive growth outlook. Yet 10-year Treasury yields are on course for a fourth monthly decline, suggesting a negative growth outlook. So which is it?
Using a number of assets, we'll attempt to aggregate the evidence to see what the market "thinks."
S&P 500
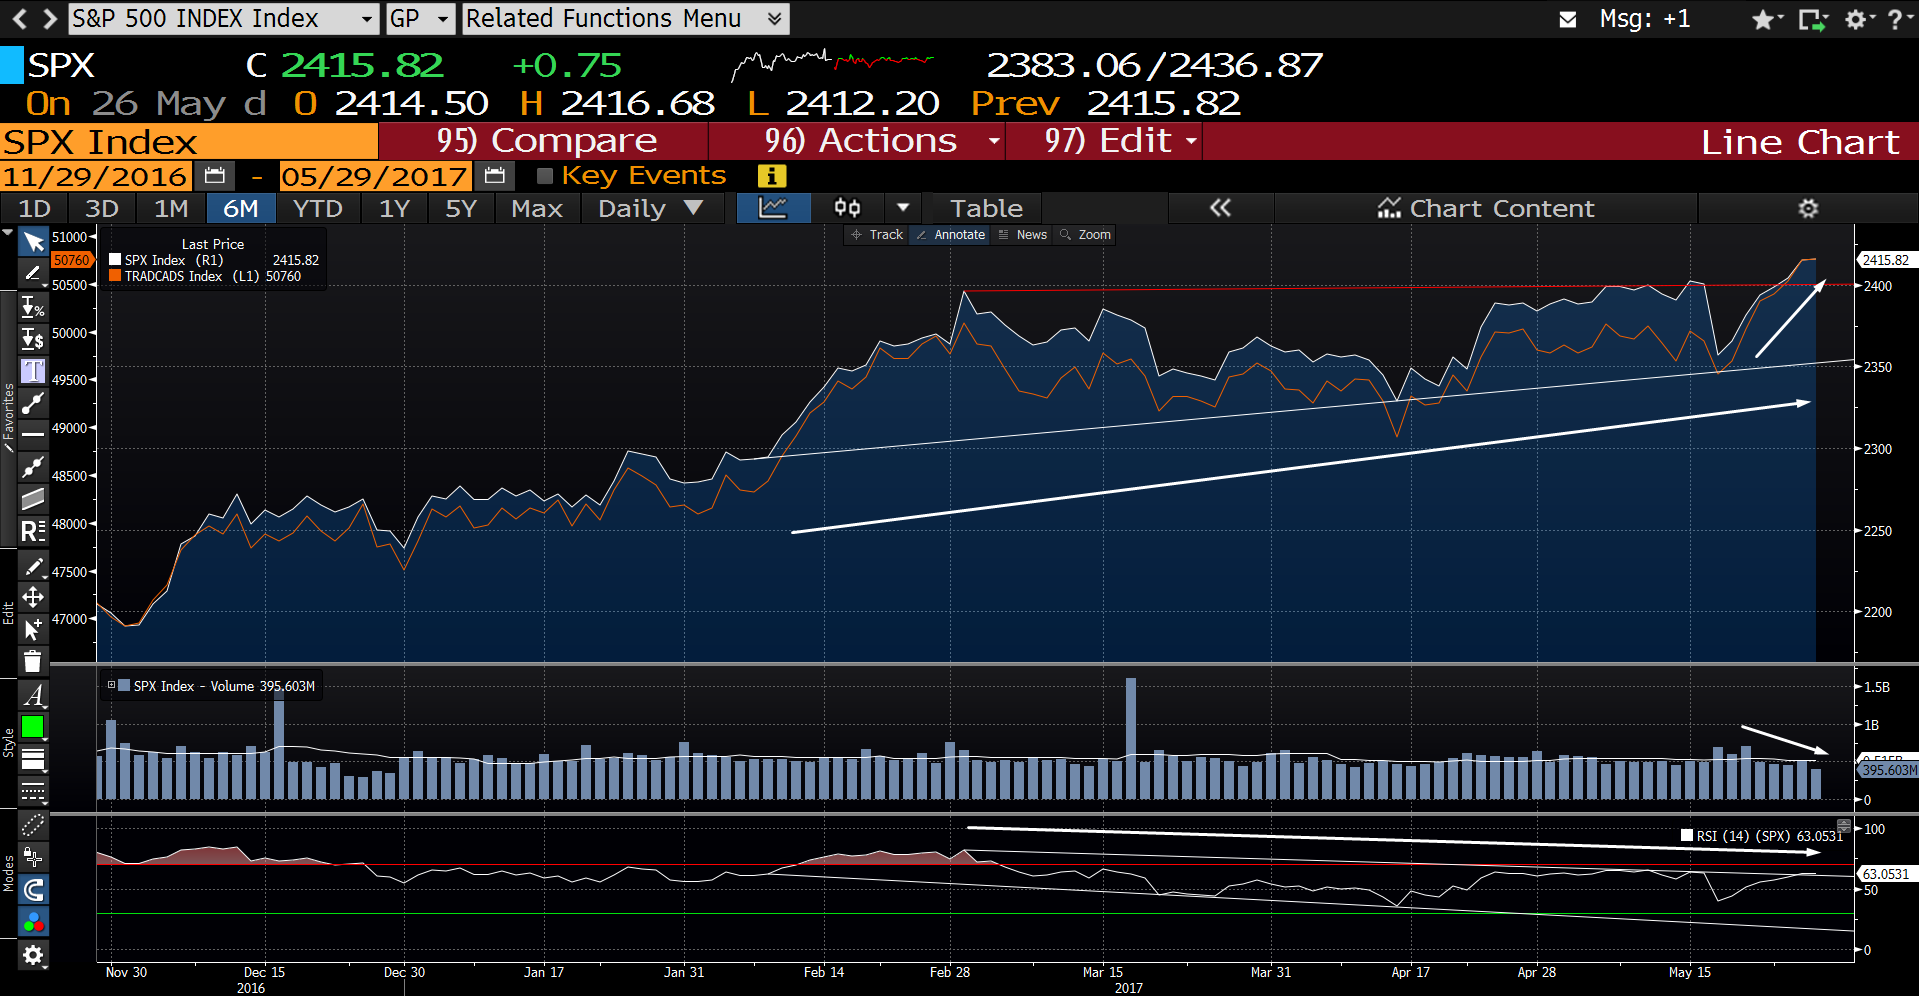
Though the S&P 500's price advanced, the argument goes, the market breadth didn’t follow. That means that while a few mega-caps led the index's price higher, a greater number of stocks did not actually go up. A market isn’t expected to sustain advances without the support of broad participation by its components.
Stock Participation
On the chart above, the S&P 500 (white) made advances ahead of the Advance-Decline-Line (Orange), which measures the distribution of stocks rising and falling. While the Advance-Decline-Line did catch up with last week’s record-breaking advances, since February, it was worryingly below the price.
Investor Participation
Additional support bolstering this argument can be found in the negative divergence between volume of trades within these advances, as well as the strength of the advances, as determined by the Relative Strength Index (RSI), which measures the speed and change of the price. In this way, a rally on high volume is seen to be sustainable, whereas a rally on a decline in volume is an omen of a possible fall. Last week’s rally was built on lower-than-usual volume, rather than what one might have expected to be higher-than-usual volume, suggesting the current price inflation is artificial and will not last.
Relative Strength
Finally, as measured by the RSI, the strength of the rally—like market breadth and volume—has been declining, even as prices rallied, suggesting yet another negative divergence.
Market Breadth Through Relative Strength
The McClellan Oscillator measures the difference between the number of advancing and declining stocks.
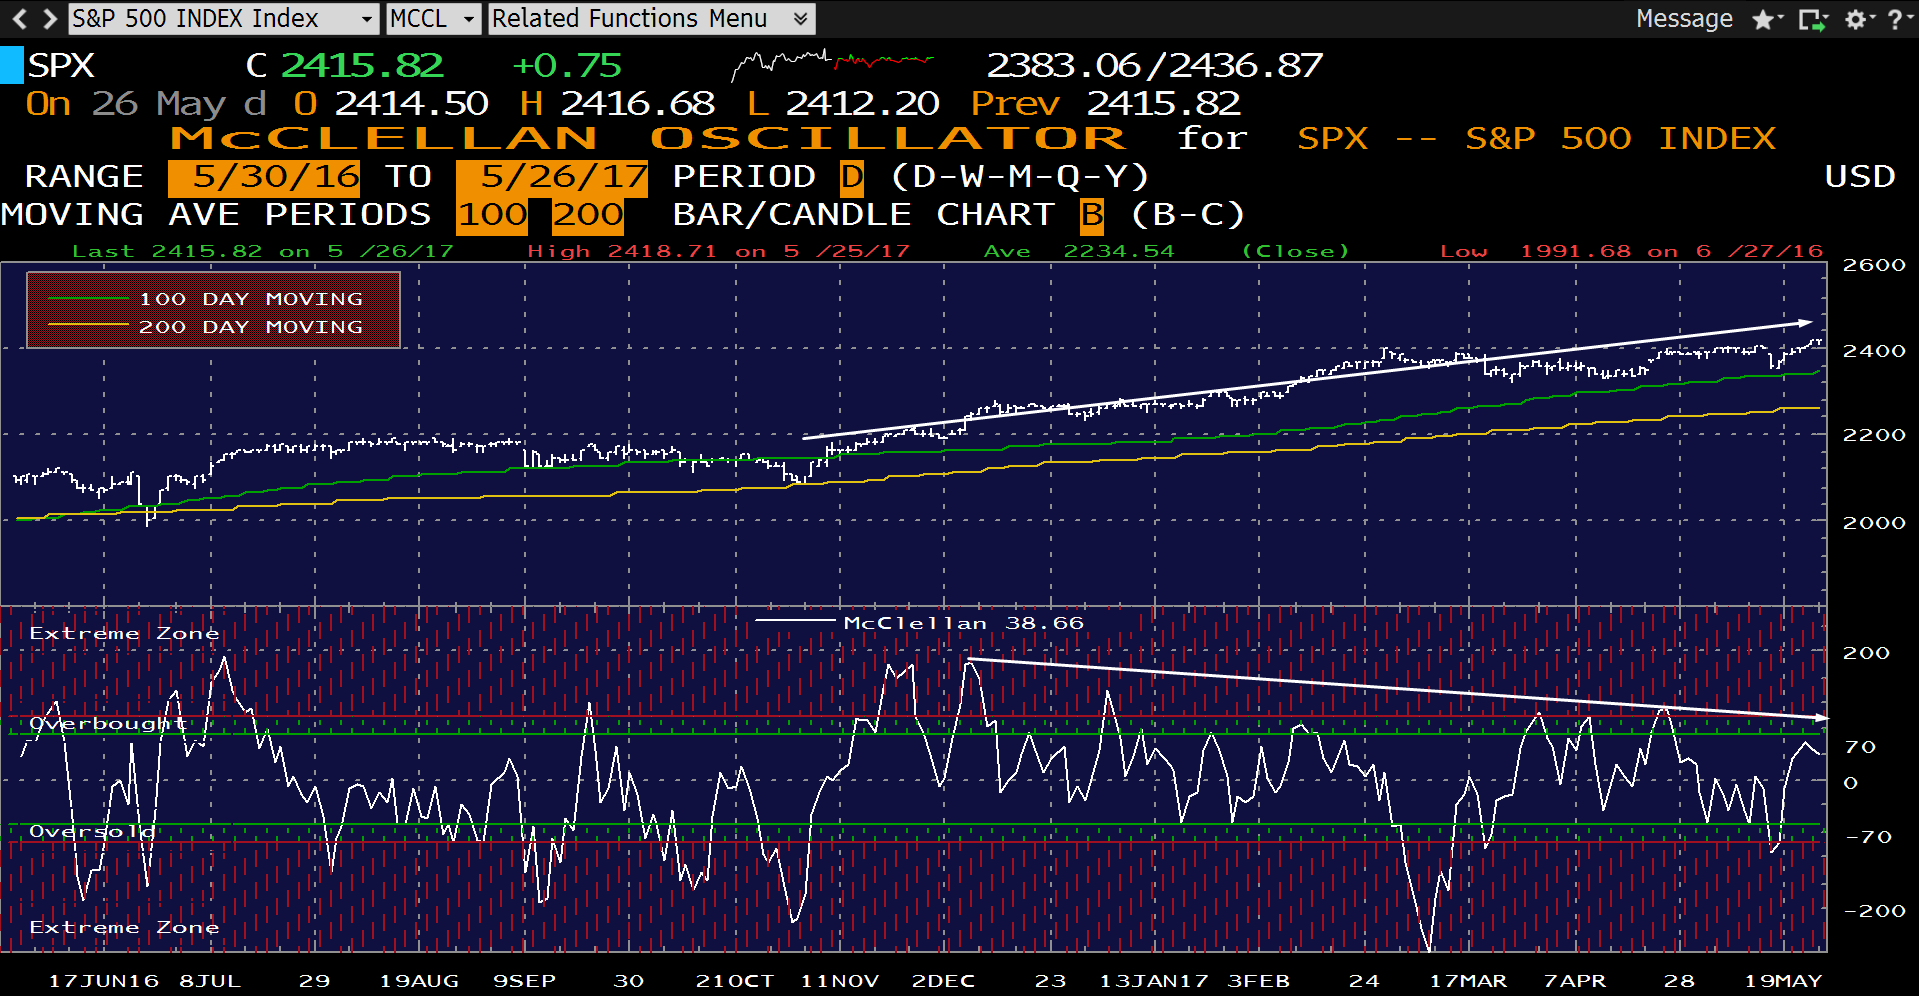
While the SPX price is in an uptrend, the oscillator is in a downtrend.
Bonds
Bonds are affected by two factors: (1) interest rate outlook and (2) safe haven status, when growth assets seem risky. When the economy is expected to grow, which means both higher interest rates as well as equity rallies, investors neglect bonds in favor of equities.
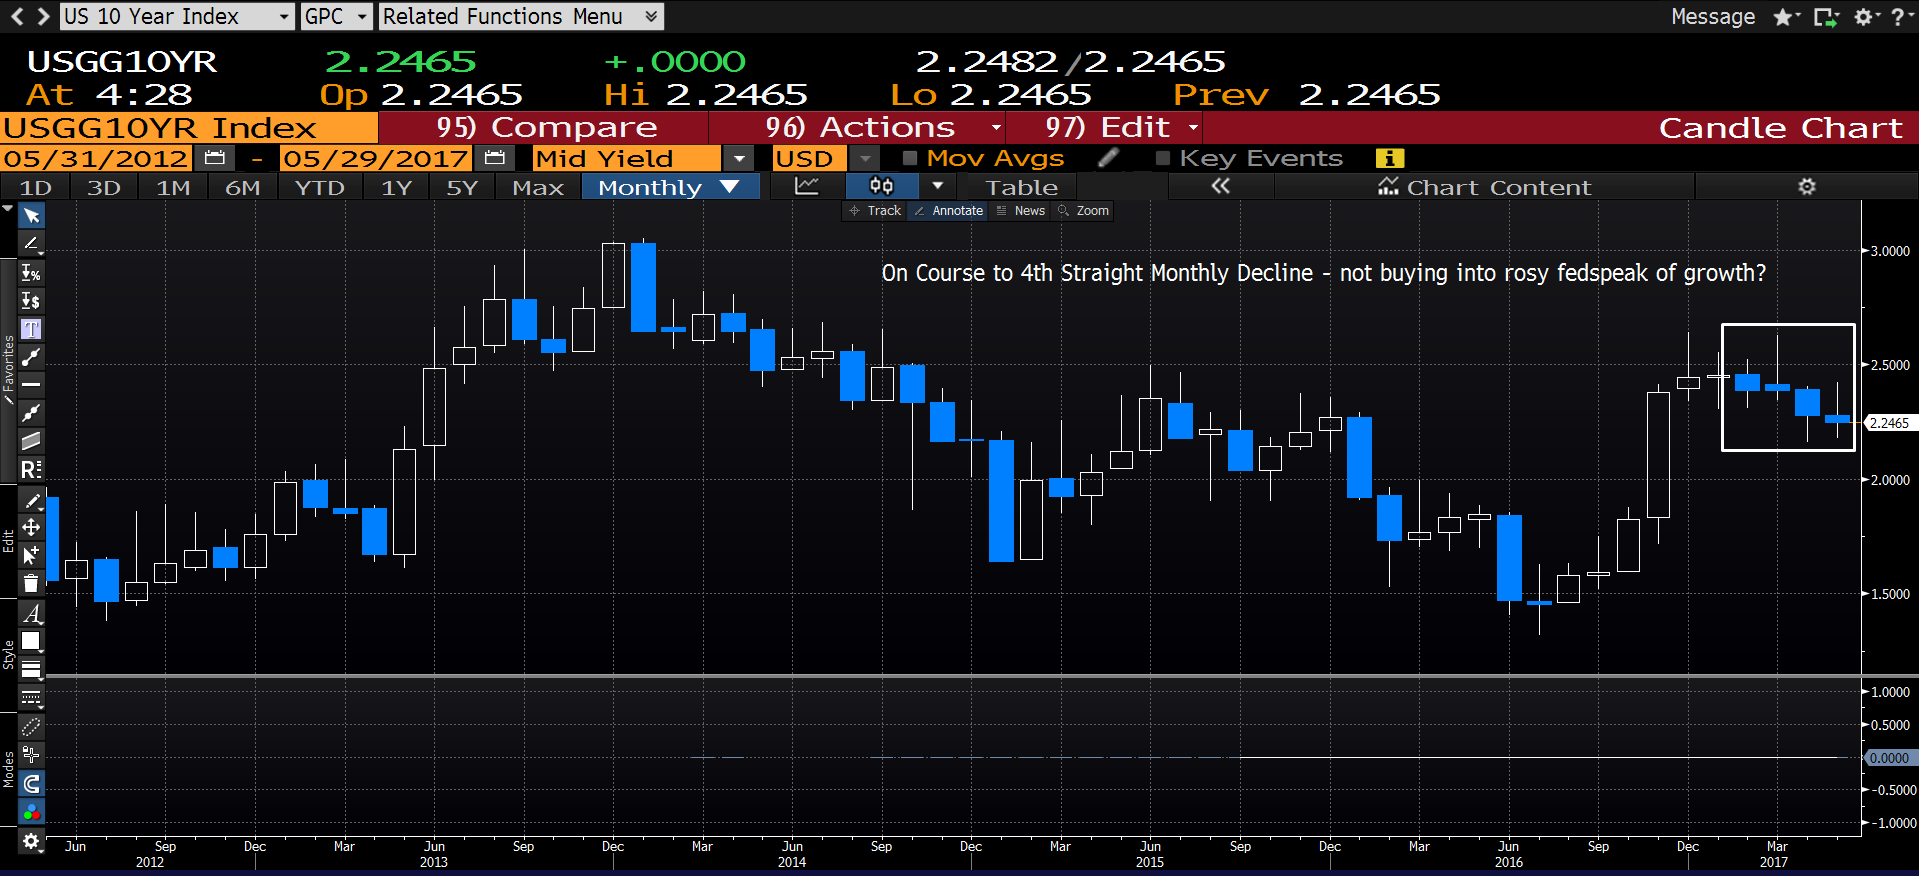
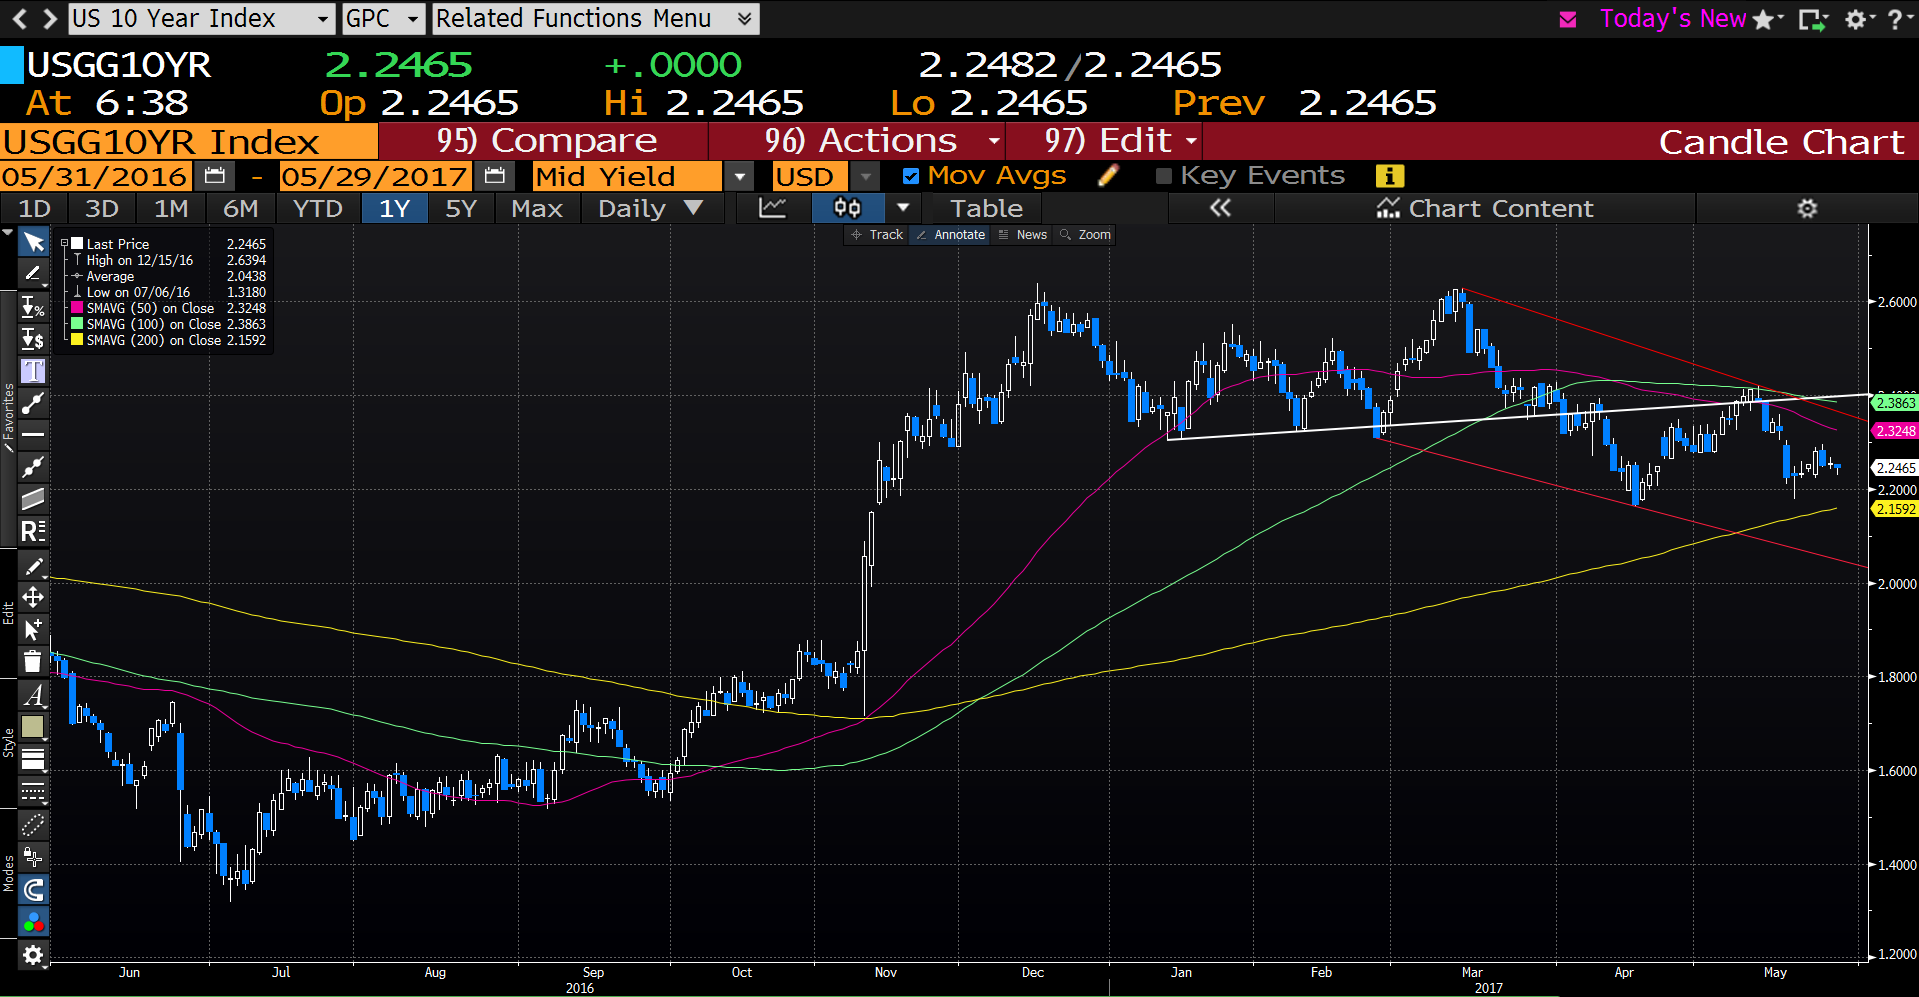
When the outlook does not support economic growth and equity rallies, bonds are in demand. We are heading toward a fourth straight monthly decline for the 10-Year Treasury, as well as a completed Head & Shoulder patter complete with return move, in which the H&S neckline proved its resistance, as demand is ever increasing, suggesting that investors’ outlook does not support growth.
U.S. Dollar
When investors expect interest rates to rise, they are more likely to buy the dollar; when markets expect interest rates to decline, the dollar is generally sold off.
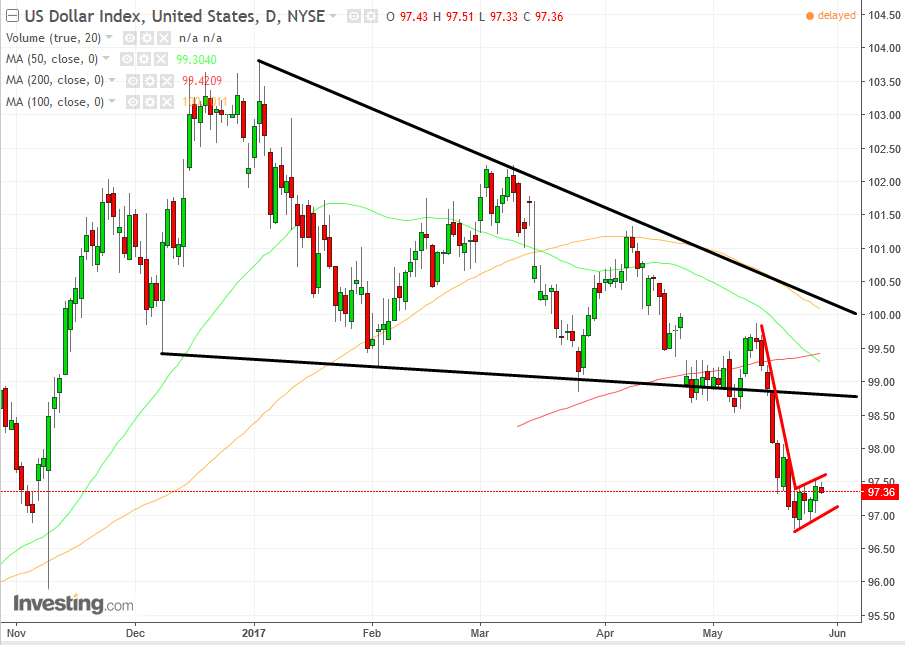
The dollar index completed a top on May 16, when it broke clear of its trading pattern since December, with a close of 98.105, only 25 pips from the low of the day. It was a sign that the bears had taken control.
This was followed by another day of declines, to a close of 97.575. During the following two days, May 18 and 19, the USD seesawed back and forth before settling into an additional decline to a close at 97.142, on the 19th.
Since then the price has been trading within a “rising flag” pattern signaling a bearish continuation. The telltale signs of this reliable pattern are a breakout, a sharp move and a consolidation with a bias toward the price origination, which means it rises when it's bearish.
Note that the 50dma crossed below the 200dma, in what is called a Dead Cross by some as the recent price average falls below the longer price average and suggests it will continue to fall. The fact that this Dead Cross occurred after the top breakout invests it with meaning.
The dollar breaking down—as with Treasury yields—suggests investors don’t expect interest rates to meet market expectations. Meaning markets aren't expecting the Fed's full complement of promised rate hikes this year.
In summary: overall market breadth, market participation and momentum provide a negative divergence to the rising prices; bonds are a window into investor sentiment; the dollar is being sold off. All this suggests a weaker outlook.
Trading the dollar
Now is an auspicious time to enter a trade, as the USD's price is at the top of the flag, and a trader may rely upon its resistance, while placing a stop-loss above the flag. It should be noted, however, that the pattern is complete only if and after it forms a downside breakout, which at the current angle is below 97.
Be aware, too, that this pattern is fraught with return moves. So, if you do want to trade it now, or even after a breakout, manage your trade to allow a return move to the flag. Since it’s rising, it could go even higher than the breakout price level. The flip side of waiting for a return move before entering is that you may miss the trade.
