The fundamental environment just keeps getting better for Tesla (NASDAQ:TSLA) shares. On Friday, the Palo Alto, California-based electric vehicle manufacturer announced record vehicle deliveries in Q1 2021.
That alone would be good news for the stock. The added sweetener? The single biggest market driver right now is President Joseph Biden’s COVID-19, multi-part relief package, designed to help provide a stronger recovery for the US's reopening economy. And one of the core programs on the Democratic agenda is addressing climate change, which includes tightening emission regulations. As such, a key element in the administration’s green initiative is to push drivers into electric cars, an obvious win for Tesla.
To that effect, Wedbush tech analyst Daniel Ives yesterday upgraded his rating on TSLA to 'Outperform' and gave the stock a $1,000 price target within the next 12 months. That would be a 31% boost from yesterday’s $691 closing price. He also provided a long-term view of $1,300, a gain of 88%.
We expect the stock to hit $830 in as little as a month. Three weeks ago, we argued that “Tesla shares may have reached a bottom.” We believe that yesterday's trading provided that confirmation.

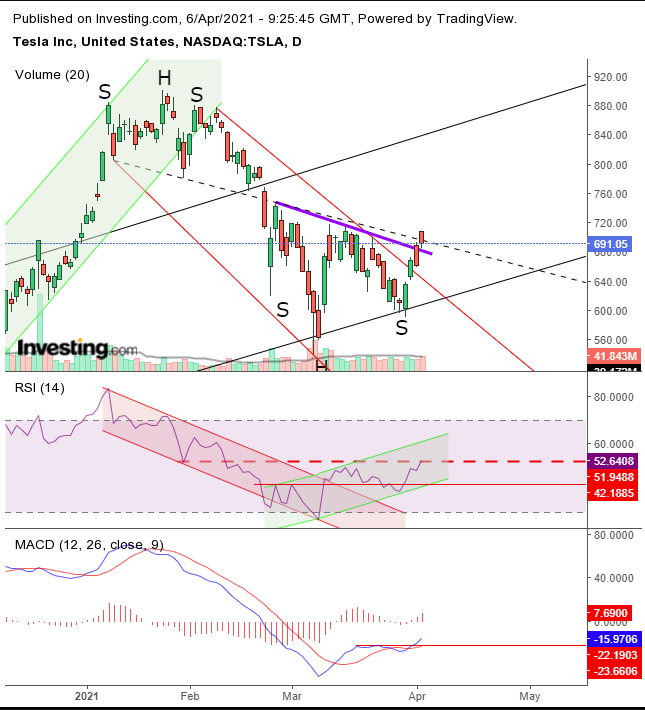
On Monday, the stock completed a H&S bottom, when it crossed over the pattern's neckline—the trend line (purple) that connected the pattern lows. Next it's worth seeing if we can identify the technical pressure points and understand how this reversal fits into the chart.
The H&S moved precisely within both the rising channel that emerged after the March bottom and the falling channel since the Jan. 25 all-time high.
The price failed to maintain a secondary, steeper ascending (green) channel since the October low, which temporarily helped the price break free of the original channel. The price then topped out with a H&S of its own.
Notice how both head-and-shoulder structures share the same neckline, which conforms to the technical principle of a support turning into a resistance. These two H&S patterns are in mirror image, and if yesterday’s breakout endures, we expect the price to retest its January all-time high of $883.09.
However, while the price did rise above its immediate (purple) neckline, and though that trendline provided support when the price pared gains on Monday, the price did find resistance by the original H&S (dotted) trendline since Jan. 11. Also, volume remained flat.
We’d like to see a spike in volume to increase the odds of a consensus for the breakout. We can see the same hesitation expressed in momentum via the RSI. After bottoming out, and confirming a new base, the RSI found resistance by the previous support, emitted via the H&S top (dotted red line).
The MACD, on the other hand, regained a bullish cross after failing to maintain the first one, when the stock price dipped, creating the left shoulder.
Trading Strategies
Conservative traders should wait for the price to scale to $705, then remain above the neckline for at least 3 days, preferably to include a weekend, and retest the pattern’s support.
Moderate traders would be content with a close above $700.
Aggressive traders could buy shares at will, provided the risk fits their budget, timing and temperament.
Here’s an example of how to set up a basic trade plan:
Trade Sample
- Entry: $690
- Stop-Loss: $680
- Risk: $10
- Target: $830
- Reward: $140
- Risk:Reward Ratio: 1:14
Author's Note: The above is a trade sample, not the actual analysis. That’s in the post. If you didn't read it and understand the risk parameters, don’t make the trade. The word “sample” implies there are other approaches that can be used for this trade. You need to develop your own style that best suits you, depending on your resources, time and risk aversion. Until you do so, take small trades, to develop your skill. If you’re after big bucks, you will not learn anything but you'll definitely and lose all your money, for good measure. Happy trading!
