Much has been written about the incredible rise of Tesla (NASDAQ:TSLA) stock. The reasons the electric vehicle maker's shares have skyrocketed are myriad and include: its status as a green initiative; the many technological applications of its business; and the charisma of its founder and CEO Elon Musk.
As well, we've noted previously that both Bitcoin and Tesla are assets favored by similar, young, non-traditional investors. That connection was reinforced recently when it was revealed that Tesla bought $1.5 billion worth of BTC during Q4 2020.
There's also growing interest from savvy institutional investors, though that cohort is still small. Nevertheless, Norges Bank, Norway's central bank, which oversees the world's largest sovereign wealth fund, revealed that it had bought shares in a number of EV stocks including Tesla during the fourth quarter. Of course, Norges also gained value from Bitcoin in the process.
By February, Tesla had made more money via the value of its Bitcoin holdings than it did on actual car sales. When the cryptocurrency hit $60,000 this past weekend, Tesla made over $1 billion.
In early March, we gave a bearish call on Tesla. We argued that the Palo Alto, California-based automaker was entering a take-profit correction, ahead of its shares once again continuing to rise.
We believe that phase is now over and Tesla's upward trajectory is about to continue.

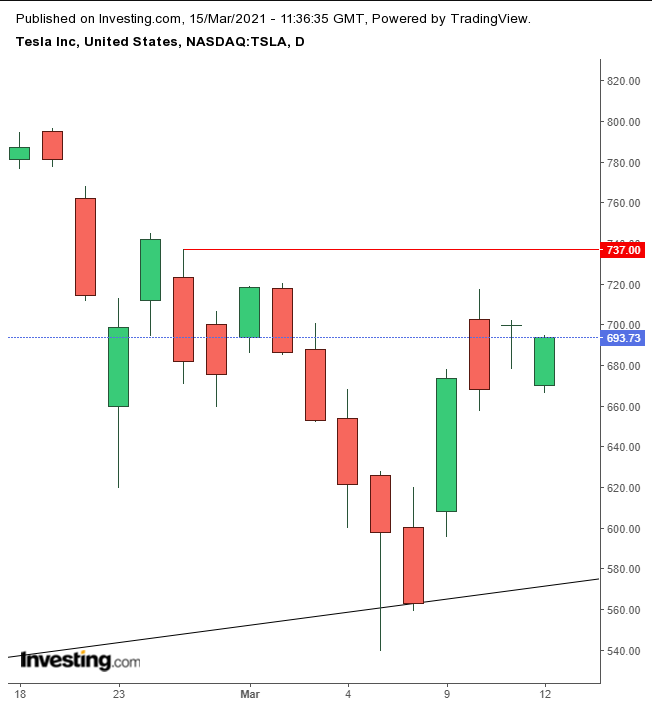
Tesla bounced off the uptrend line since June and may be about to complete a V-bottom. It is very difficult to trade off a V-bottom, because the bounce is so fast you can miss the trade. Also, it’s difficult to determine when the pattern is complete.
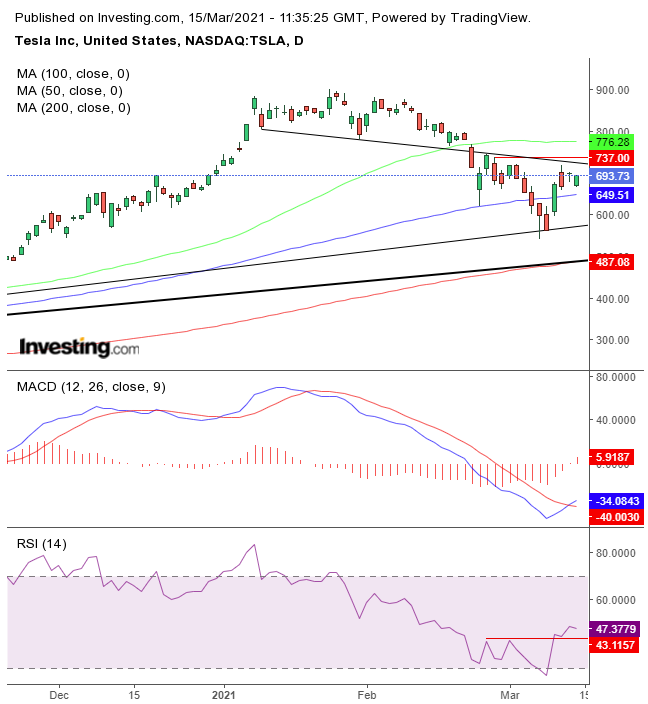
By considering the broader view, below, we'll be able to explain why we think the stock is about to complete a V-bottom.

The price has found resistance by the neckline of the H&S top. The chart could be viewed as a puzzle, which includes different technical pressure points. Sometimes they all come together to form a single, coherent picture, if you know how to recognize that.
The 200 DMA is aligned with the uptrend line since the March bottom. The price just overcame the 100 DMA; all it has left is to do the same to the 50 DMA, which would protect the previous record.
The RSI already completed its own bottom, showing that momentum is on the rise, and the MACD’s short MA crossed over the long MA, after having reached an oversold condition.
Therefore, if the price overcomes the $740 level, we’d expect it to take on the record—a closing price of $883.
Trading Strategies – Long Position Setup
Conservative traders should wait for the price to climb at least past $750, then return to establish a base above $720.
Moderate traders would go long after the price provides the same upside breakout and dips, as profit-taking and maybe shorting, for a better price, if not for evidence of support.
Aggressive traders could enter at will, provided they understand the entire post and accept the additional risk that comes with their search for higher profits, if they don’t wait for further confirmation. Money management is key.
Here’s an example of a basic but coherent trade:
Trade Sample
- Entry: $750
- Stop-Loss: $700
- Risk: $50
- Target: $900
- Reward: $150
- Risk:Reward Ratio: 1:3
