By Pinchas Cohen
In yesterday’s post, we provided a bullish midterm analysis for gasoline futures which, if realized, will trigger a long-term bullish view. Today, we will confirm previous oil bearish analysis on the very same fundamentals.
Tropical Storm Harvey is bullish for gasoline and bearish for oil, because Texas based oil refineries are down and may be down for months. Should any further damage occur, they could be down for even longer. Without the ability to refine oil, there will be no demand for the commodity. All the while, crude oil will continue to be imported, amassing stockpiles.
Supply drowning out demand will push the price down. Energy demand for oil will be shifted to gasoline. Hence, gasoline’s rise is expected to continue.
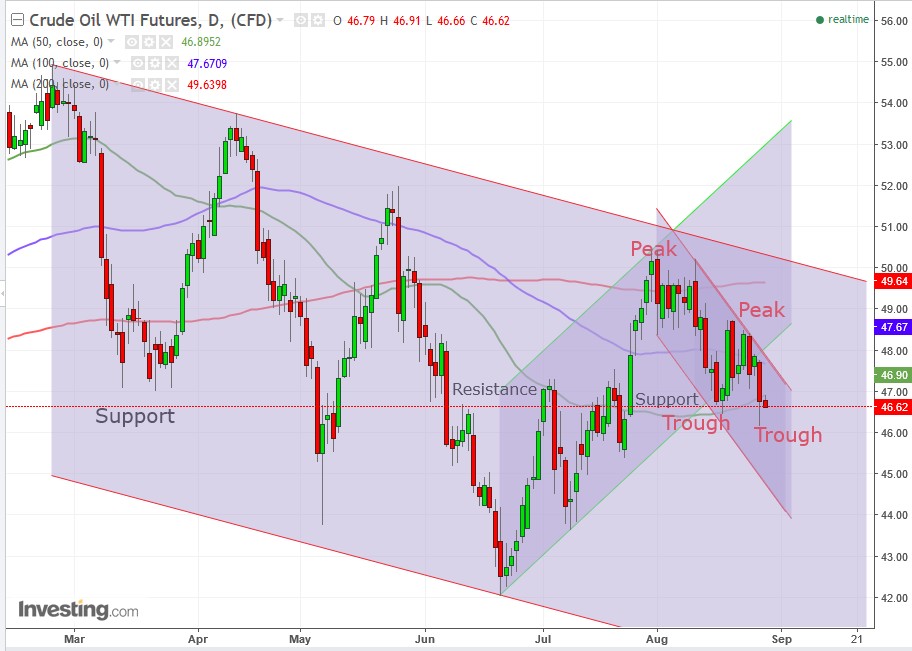
Technically, gasoline completed a daily trend-reversal with a head and shoulders (H&S) pattern, whose target realization would complete the same pattern on a massive scale. Oil has recorded an end to the short-term uptrend and embarked on a short-term downtrend, within the long-term falling channel since February.
After providing a bearish analysis for oil at the beginning of the month, we provided a follow-up view that oil’s consolidation between $48.50 and $49.50 in the following days has had the potential of a continuation pattern of its short-term uptrend line since June 21. If realized, it would break out of the falling channel since February, whose top was at $51 at the time.

After the August 14 downside breakout of that consolidation, and the breakdown of its potential continuation trajectory, we warned that the short-term uptrend is still intact. Yesterday, two signals were provided that increase the probability of a resumption of the long-term downtrend.
Long-Term Downtrend To Resume
First, oil's price decisively crossed below the short-term uptrend line. Second, it registered a lower trough than its previous, August 17, $46.46 price, with a new low of $46.16. Theoretically, that completes the framework for a new downtrend, with two lower peaks and troughs.
The last line in the sand is the $46.00 price level, which has proven to be a key level for support and resistance since March 14. The final signal that the short-term trend had fully reversed would be a close below the August 17, $46.46 low.
The 50 dma (green) – which provides the last support – represents the short-term uptrend, while the 200 dma (red) represents the long-term downtrend. The 50 dma has proven to be a catalyst since July 3, as it marked the resistance level throughout the price’s upside breakout on July 25, which then turned to support on August 17 and is now being retested.
A word of caution on what should be incorporated when setting stop-losses: even if the short-term uptrend since June 21 has ended, the price may rebound to retest the uptrend line’s resistance, chasing it all the way back to the top of the falling channel and the $50 key level before it resumes falling down toward the $40 level.
Targets
- $45.40 which is the previous July 24 trough
- $45.00 – psychological support
- $43.65 – the July 10 trough
- $42.05 – the June 21 trough. A break of this support would signal the continuation of the falling channel.
- $40.00 – psychological support
Trading Strategies
Conservative traders who don’t want to wait for a close below the former trough may wait on a short position for a correction toward the top of the new, August falling channel, at $47.75 per today’s angle.
Moderate traders may wait on a short for a correction to the psychological resistance of the round $47 number.
Aggressive traders may short now.
Very aggressive traders may take a long position, counting on the key level support discussed above, toward the top of the channel, or at least until under the psychological round-number resistance of $47.
Note: Amateur traders would rush in without deciding on an exit – for both profit and loss. Aside from support and resistance, providing key levels for stop-losses and take-profits, traders must put in place a system in which they ensure that potential gains outweigh risk, or they are doomed to lose, no matter how great their technical analysis skills.
A rule of thumb is minimum 1:3 risk-reward ratio. Allowing winning trades to mature while cutting off losing trades at the knee exponentially increases the likelihood of consistent trading success.
