By Pinchas Cohen
Hurricane Harvey stormed electronic trading Sunday night, causing gasoline futures prices to rocket higher by 6.4 percent. Today, the surge extended after the storm knocked out nearly 15 percent of refinery capacity in the US. Gasoline prices are expected to continue to roil upward, as further disruptions are expected.
Harvey is on the path to Port Arthur, Texas, which produces 600,000 barrels of fuel a day. The rains haven't ended and energy companies are still assessing the damage, but it could take months for parts to be sourced and repairs to be made to electrical equipment that's been damaged. Harvey is rampaging through the very center of the US oil infrastructure; the Texas coast is home to almost 30 percent of the country's refining capacity.
Investors may be confused as to why the price of WTI is falling while gas futures are surging. Shouldn’t the storm interrupt the supply of crude oil in much the same way it does gas?
The difference is that the refineries (though currently out of commission) are the actual purchasers of crude oil which they then refine; when refining capacity is down, markets expect demand to fall. In the case of gasoline, however, the end customer is the general consumer who will continue to drive irrespective of refinery capabilities, thus supporting the price of gasoline without consideration for the current situation. Thus, while the price of gasoline is expected to remain supported, the demand for oil is anticipated to continue to fall.

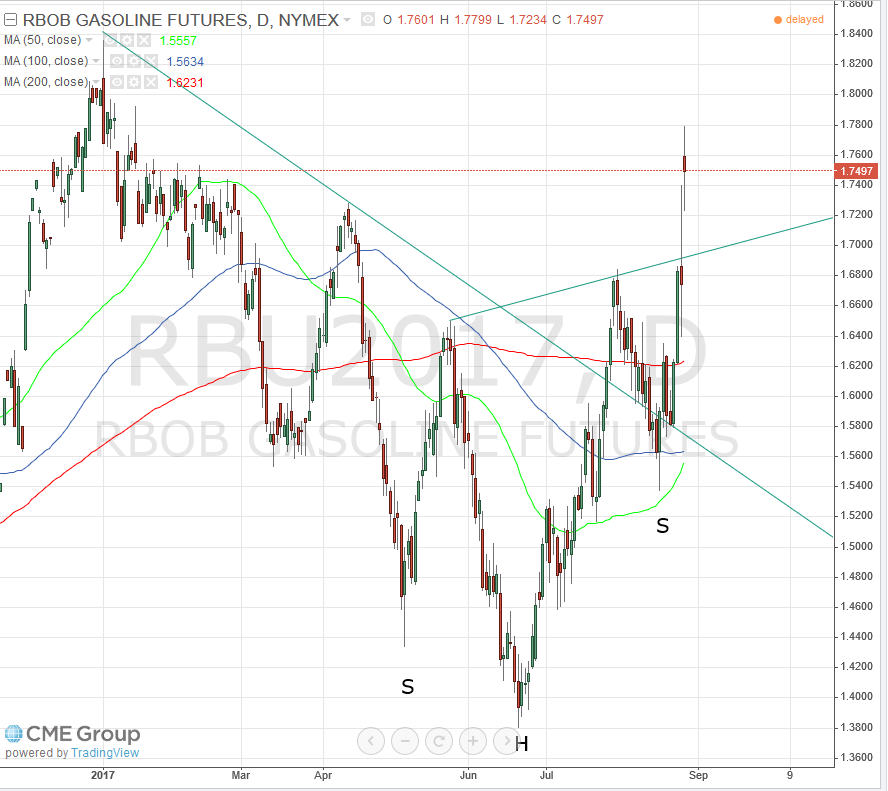
From a technical perspective, today’s surge completed a head and shoulders (H&S) bottom. Notice too, that it also overcame the 200 dma (red), after the 100 dma (blue) provided support on the August 17 dip, when after penetrating it closed above it. The 50 dma (green) is pointing upward and is about to cross above the 100 dma, as well as cross above the downtrend line since December 30, after the price had already done so on July 27, confirming it with a return move that confirmed its support.
The target implications, based on the height of the pattern, is 27 cents a gallon, from 1.65 to 1.82.
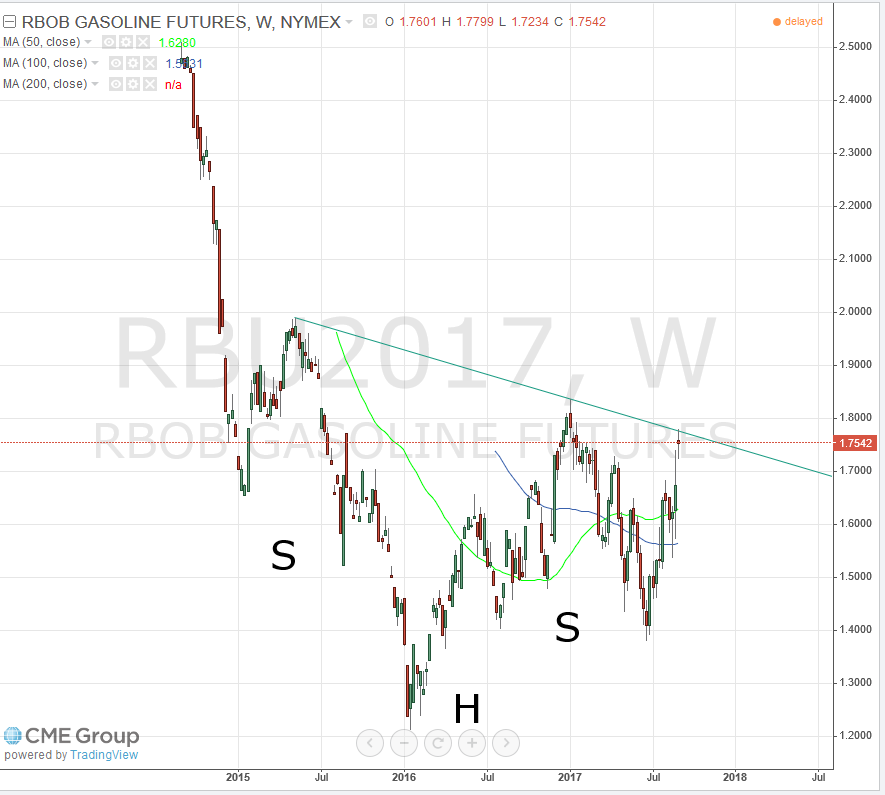
Should that target materialize, it will have completed another, much larger pattern.

Right now, the price has stopped at the downtrend line since May 2015. This trendline plots the peaks, while the January 2016, 1.2132 low constitutes the head of a massive H&S bottom. Should the daily H&S target materialize, it will have crossed above the massive, 2-year bottom. The target implication of that reversal would be 55 cents, with a target of 2.2500.
Trading Strategies
Conservative traders would not stomach the foreseeable volatility. Let’s remember that while the daily H&S completed, the price is under the pressure of a downtrend line since May 2015.
Moderate traders would rely on the fundamentals of additional storm interruptions increasing gas prices, reflected in the H&S, but would wait for a return move—should one occur—to the neckline, at around 1.7000, before entering a long position.
Aggressive traders may short the potential return move and turn around with a long position after a return move toward the 1.7000 price level.
