by Pinchas Cohen
Kellogg Company (NYSE:K) is scheduled to release its earnings report tomorrow, before market open, for the fiscal quarter which ended September 2017. According to Zacks Investment Research, EPS forecast is $0.93 versus $0.96 YoY. The company has set its forward guidance for the year at $3.97-4.03 EPS.
The company is losing on two fronts, in that it not only underperforms the benchmark, but it’s experiencing almost a fifth of its value this year. While the S&P 500 has gained 17.6 percent this year and 19.5 percent since the US election and the awakening of animal spirits, Kellogg has lost 18.15 percent this year and (after an initial, first-day 2.65 percent surge) it lost 19.45 percent since the frenzied Trump trade.
Can Kellogg Keep Up With A Rising Dollar?
The packaged food industry is struggling with weak consumer demand. On top of that, the stronger dollar makes its products less competitive than the ever-increasing competition. A strong dollar means higher relative prices for Kellogg's dollar-denominated cereal compared to other currencies. Considering the dollar is expected to strengthen after its short-term reversal, this, in tandem with continued competition, means that sales are expected to decline.
The company disclosed a quarterly dividend to be paid on Friday, December 15. Shareholders of record on Friday, December 1st will be issued a dividend of $0.54 per share. The ex-dividend date is Thursday, November 30th. This represents a $2.16 annualized dividend and a yield of 3.51%. Kellogg’s payout ratio is presently 97.74%.
Research firms believe the stock will rise. Piper Jaffray gave the stock a “buy” rating, with a $78.00 target price. Zacks Investment Research, on the other hand, downgraded its rating from a “buy” to a “hold.” JPMorgan Chase actually upgraded its rating from “neutral” to “overweight”, raising its price objective to $78 from $76.
Charts Signal Further Declines Ahead

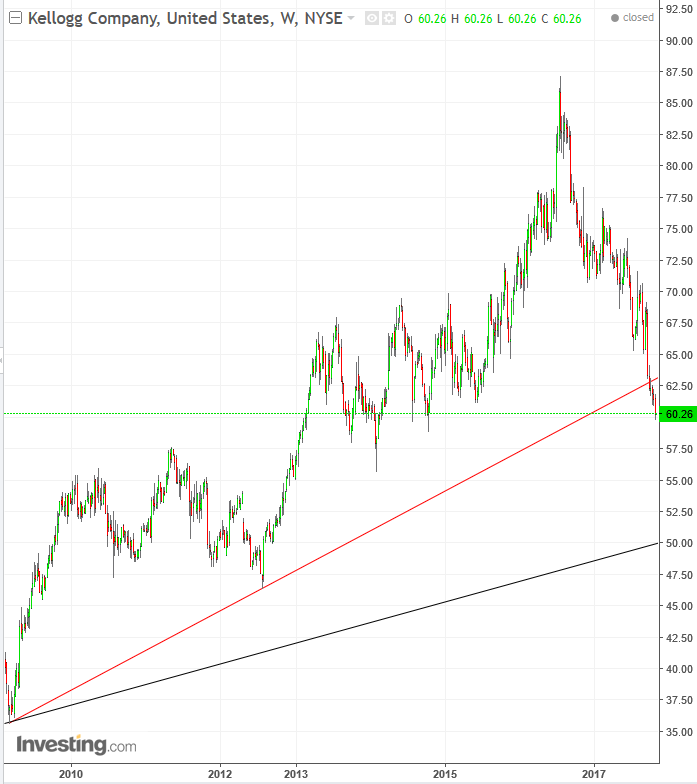
The fact that the stock has been trading in a downtrend since June 19 of last year and the high price of $87.16 is something that anyone can tell by looking at this chart. However, what may be missed by the casual observer is the fact that on October 19 the stock decisively crossed below a major uptrend line since March 2009 (red line).
If you don’t understand the significance of the date, it’s the beginning of the current and second longest bull market in the history of the US. The black line below is the macro uptrend line since the dotcom crash. That is still intact.
The failure of demand to keep the price over that long-term uptrend line is a signal for further, more drastic declines.

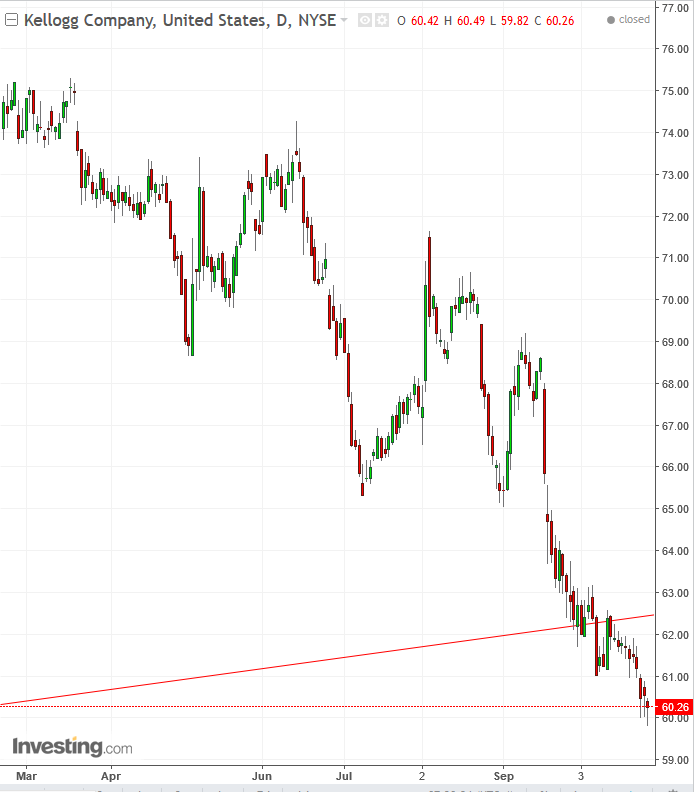
The initial breakout penetrated 2 percent below the long-term uptrend line, satisfying a moderate filter. There was also a successful return-move, which proved the integrity of the now-resistance of the prior support of the long-term.
Friday’s trading however, formed a bullish hammer, suggesting an upward correction to at-least $61, the expected resistance of the October congestion and possibly even a second return-move, which is apt considering the significance of this long-term reversal.
Trading Strategies
Conservative traders would wait on a short for either a full return-move and confirmation of the resistance of the old uptrend line, with at least a down-day that covers the previous up-day after returning to the uptrend line, or to a close beneath Friday’s hammer’s $59.82 low.
Moderate traders may wait on a short for a return move but not necessarily for a confirmation of the resistance of the old uptrend line.
Aggressive traders may be content with a return-move to the $61 congestion-resistance and a close beneath it.
