by Pinchas Cohen
A political shift in Chile is underway, as voters returned billionaire Sebastián Piñera to the presidency on his promises to reduce corporate taxes and cut red tape. Chile is the the world’s largest copper producer and the current political situation has temporarily ended a straight 9-day rally, which started on December 6 and halted yesterd, in which the price of the red metal gained 7.55 percent.
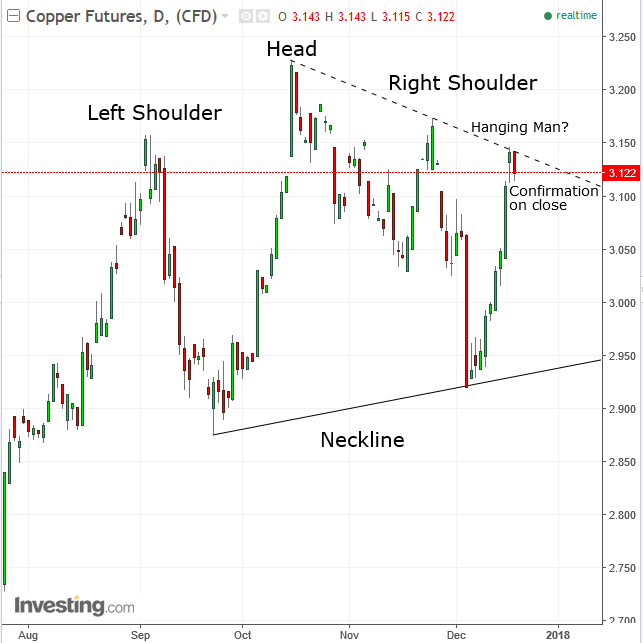
As of the time of this writing, the price has jumped again, extending the streak to a 10-day advance before prices hit a brick wall at the downtrend line since October 16.
President-elect Piñera is considered sympathetic to the mining industry, certainly more so than the current President Michelle Bachelet, who raised corporate taxes and empowered labor unions.
The political shift in Chile is reminiscent of the current US political situation: a billionaire was elected president on the promise of cutting taxes and red tape.
The US economy is currently in an uptrend, and all four major stock indexes are setting records on President Trump's pro-business agenda. If this in any way mirrors what might be in store for Chile, we can expect a positive outlook for Chile's economy going forward. One likely by-product of Piñera's win is smoother copper production, which could reduce prices.

Time To Turn Bearish
While we have been bullish on copper over the last few months, specifically on September 14, from where it rose 9.6 percent and on December 6, from where it climbed 8.5 percent, we're shifting our view to bearish.
The price has been traded since early September in a H&S top pattern. A confirmation to the bearish bias is the leading momentum-indicator RSI moving below a downtrend line of its own, as it provides a negative divergence with the price when the October 16 peak surpassed the preceding September 4 peak, as it formed the left shoulder and head of the pattern. Since momentum creates movement, it is considered a leading indicator, in that it moves before the price goes down, signaling that the price is about to decline. Additionally, it turned below a resistance of the November 4 high.
The main trend is still considered up, visually expressed by the uptrend line since October last year, guarded by the 200 dma (red), so to speak. Overlapping supports reveal where the supply-demand pressure points are.
Trading Strategies – Short Position
Conservative traders would wait for a decisive downside breakout of the pattern, uptrend line and 200 dma, for an actual trend reversal, before entering a short position.
Moderate traders may enter a short position upon the short-term downtrend, should the price action of a falling day cover that of the preceding rising day, in confirmation of the short-term downtrend line.
Aggressive traders may bet on a decline, with a very close stop-loss.
Equity Management
Aggressive
- Entry: Anywhere up to 3.143, today’s high
- Stop-loss: above 3.143, today’s high
- Target: 2.950
Risk-Reward Ratio: 1:6 – Even if entering at the 3.115 low of the day, increasing to maximum risk.
