By Pinchas Cohen
The biggest story today is the expected economic slowdown in China, signaled by the disappointing numbers released this morning for the world's second largest economy: factory output, investment and retail sales were all down, and below expectations. For forward looking investors, this signals a reduction in China's future demand for base metals. Using this as a leading indicator, traders withdrew their demand first and shorted futures contracts, leading losses for miners, which dragged down stock averages.
Copper was especially hard hit. China is not only the world’s top copper importer, it also holds the record as the fastest-growing copper importer in the world. In 2016 it imported $33.2 billion worth of the red metal, or 27-percent of total copper imports, making the metal red-hot. This reflects an unfathomable growth in copper imports of 125,900 percent, from the measly $1.3 million, 2012 import figures.
The commodity price fell 1.27 percent today to $2.941, its lowest level in nearly a month, and a total of 6.8 percent since the $3.158, September 4 high.
Putting The Numbers in Perspective
Even though China’s growth has slowed, it’s economy is still robust. As well, since the Brexit vote, equity traders have had a track record of unusually exaggerated responses to economic data.

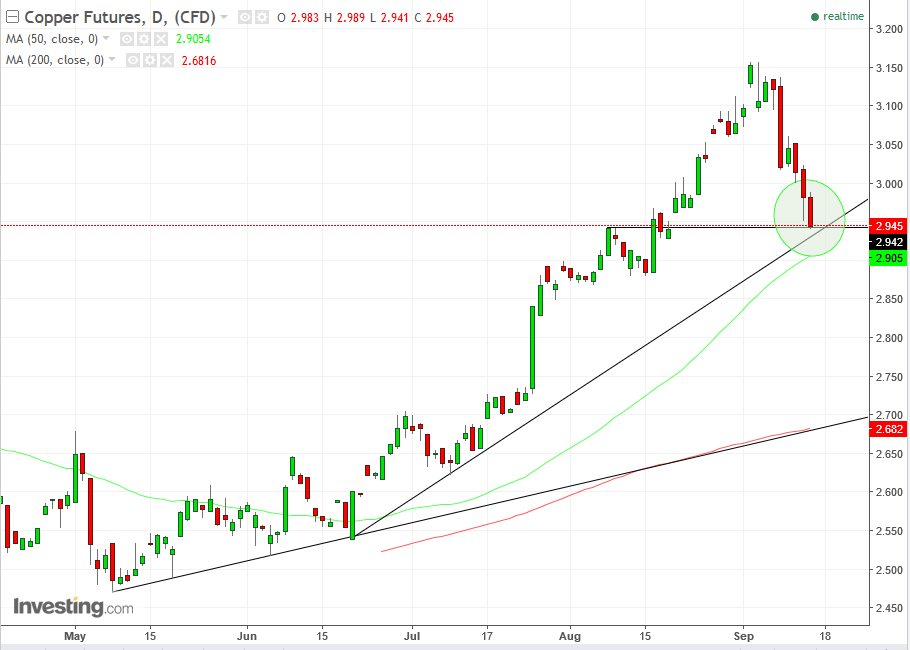
After a 9.5 rise in under three weeks, between August 16 and September 4, a correction is due. Even after this morning's bearish news dominated the markets, price stopped short above the $2.930 support of the June 21 uptrend line, confirmed and compounded by the August 8, $2.942 closing peak support in the green circle.
The meeting of support between two different market-trend gauges – the uptrend line and former peak – indicates where buyers may be stopping the price from heading yet lower. Another showing of important key levels is revealed by market structure components – the 200 dma (red) traces the longer uptrend line since May 8 and the 50 dma (green) follows the steeper, more recent uptrend line since June 21.

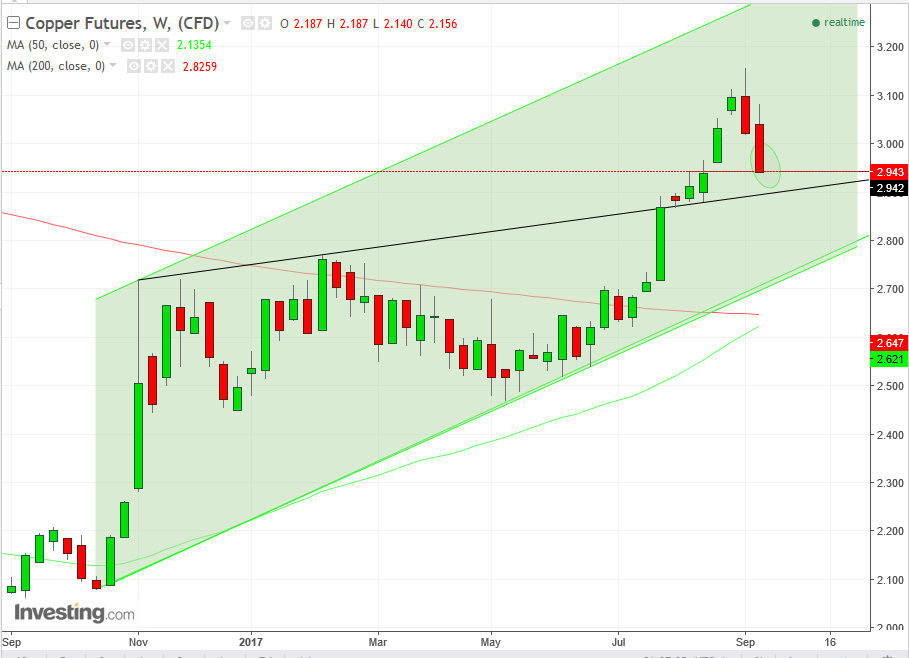
To gain an even broader perspective, look at the weekly chart which reveals the price has been trading within a rising channel since October 2016. The weekly chart also demonstrates that price overcame a resistance line plotted by peaks, for the first time at the end of July since the channel’s inception in November. This resistance line is now expected to turn into a support line. Finally, the 50 dma (green) is headed toward crossing over the 200 dma (red), which would execute a “golden cross,” which will provide a statistical confirmation to the rising trend, providing a buy signal.

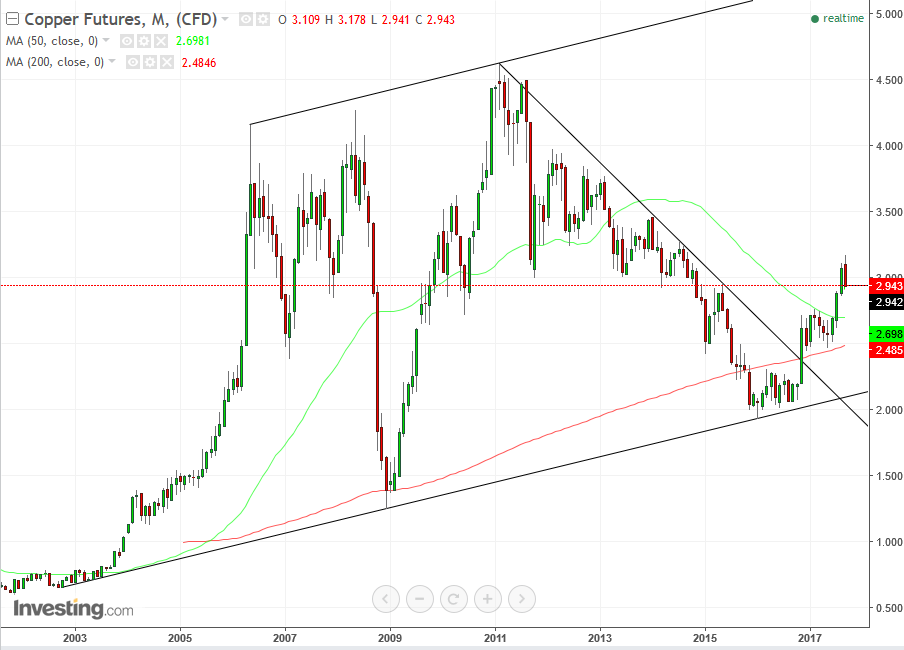
A final piece of evidence, exhibit C as it were, the monthly chart. The price of the red metal is in a macro uptrend, in which the long-term downtrend since February 2011 to January 2016 – shedding almost 58 percent of value – was “only” a correction within the macro trend. The long-term trend was put into question, when the price crossed above its downtrend line and was confirmed when it registered a series of two peaks-and-troughs, forming a new, long-term, uptrend.
We can also see the importance of this price level as the 50 (green) and 200 (red) month moving average come together to form a potential catalyst. The 50-month moving average had created a resistance for the price this year, until the price crossed over it in April, pulling up the 50-month moving average with it.
This suggests that the 200-month moving average provided a support to the 50-month and is considered bullish. It is extremely rare to find the moving averages come together like this on a monthly chart. Case in point, the last time they crossed paths was in 2005, and the price rose almost 150 percent between September 2005 and May 2006, a mere eight-month period. That’s why they call it the red metal!
Trading Strategies
Conservative traders would wait on a long position with confirmation of an end to the correction and a resumption of the uptrend, with a close above the key $3.000 level. The premium for a reduced risk will be losing part of the expected move, and it must be factored in, in terms of the stop-loss in relation to the take-profit, to allow the minimum 1:3 risk-ratio, making it an attractive trade. If the entry is at $3.000 while the stop-loss is beneath the $2.940 support, the trader assumes a potential 6 cent lost. To offset this risk, the trader would have to allow his trade to win at least 18 cents, with a target-price of $ 3.180. However, since the previous peak forms a resistance at $3.158, he must either accept a worse risk-reward ratio of 2:5 or wait for a dip to come in at a price closer to his stop-loss.
Moderate traders may go long tomorrow, after confirming that today’s close remained above the $2.940 support. While their potential for opportunity loss is less than that of conservative traders, the premium for a reduced risk of an extended decline is the potential to miss today’s rebound. Should they get lucky, the price will have reached harmony at the current level, providing them a dream risk-reward ratio, with a stop-loss beneath the support and a triple-reward profit that should be easily attainable, with even a small move, or going for a unique opportunity to have an exponentially higher reward potential than risk, riding the rally to retesting the $3.158 peak.
Aggressive traders would go long immediately, placing a stop-loss at least beneath the $2.925 support of the uptrend line at today’s angle, and as far as below the $2.90 round number. While a farther stop-loss target provides a bigger loss, it increases the odds of surviving whipsaws, potentially generating a better profit over time. On the other hand, a closer stop-loss allows more available equity for the position. This is always the conflict for traders – to have a safer position with lower profits, or larger profits with higher risk.
Build A 'Risk Portfolio'
In answer to this conflict, we suggest a “risk portfolio.” Just as investors hold cross-asset portfolios to find the balance between the highest potential returns or the lowest risk, traders may do that with their trading portfolios. A trader would divide his trading strategies based on his risk aversion, just like he would a cross-asset portfolio.
For example: a trader may allocate his equity as follows:
- 60% conservative trades
- 30% moderate trades
- 10% risky traders (close stop loss, to leave more equity available for a bigger position)
As well, similar to investors who shift their portfolio weighting of stocks according to changing risk, whether based on valuations or sentiment, a trader may shift his allocations according to market risk. When volatility increases, the trader may reallocate his weighting from aggressive to moderate and from moderate to conservative.
