Yesterday, the Dow surged 11.37%, its biggest daily gain since 1933, as Congress worked out the finishing touches to a safety net intended to combat the economic tsunami expected from the COVID-19 pandemic: an unprecedented fiscal package valued at $2 trillion.
Coming after the Dow's 37% plunge since its Feb. 12 peak, the index suddenly looked like what everyone wanted for Christmas. So, is the bear market over?
People have been comparing the current collapse with the 1987 crash. Would that mean we're headed for continued rallies from here on out, as happened then?
We think not. The situation today is starkly different. There's still no vaccine or cure for the coronavirus, despite the concerted global effort to find one — and it's likely to be a while before one is developed.
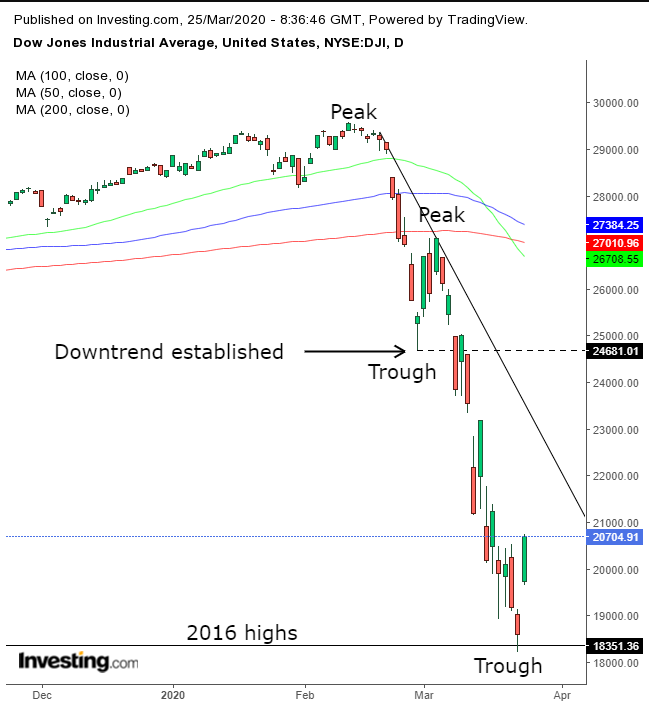
And indeed, the chart below illustrates clearly that the patterns have not altered in any significant way, despite yesterday's surge.

The Dow Jones established a downtrend, after posting a series of descending peaks and troughs, when falling below the Feb. 28, 24,681.01 low.
As we've noted a number of times before, freely traded assets don’t move in straight lines. They fluctuate between relatively smaller gains and losses according to various stages of portfolio management within the larger trend. Yesterday’s historic rally is considered a corrective rally within a downtrend.
While the fundamental story was the expected political breakthrough for the biggest stimulus spending bill ever, the technicals supported it, bouncing prices off the 2016 highs.
The first down-move from the Feb. 12 peak to the Feb. 28 low, a 16.5% slump, including intraday price action, was followed by a 9.8% corrective rally. That means the longer and larger move, the 32.8% decline from the March 4 high to the March 23 low, was expected to be followed by a corrective rally.
So, where does that leave us? According to the principles of technical analysis, operating on the weight of the evidence, we remain in bearish mode, for as long as the downtrend is in place. It will be over only if the price reverts to rising peaks and troughs.
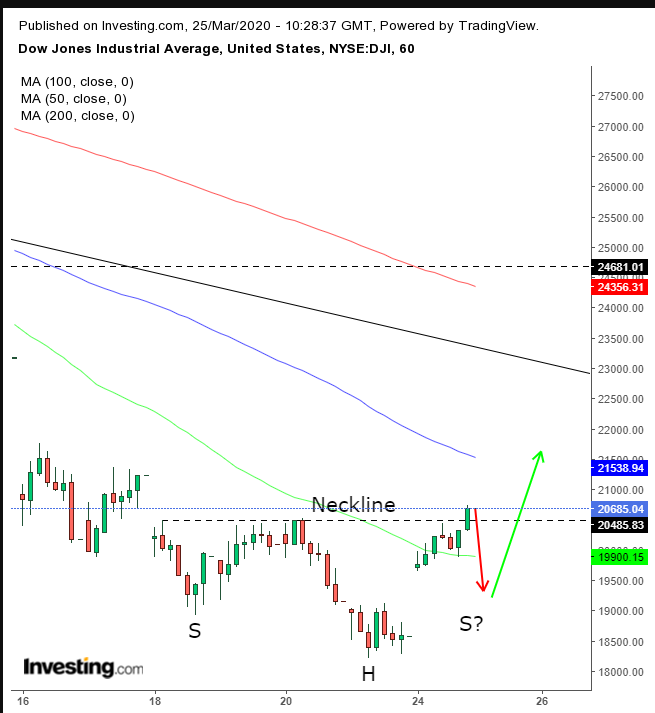
For short term traders, the hourly chart is developing a H&S bottom, as can be seen below:

Trading Strategies
Conservative traders would wait for the corrective rise to run out of steam, followed by a bearish pattern.
Moderate traders might risk a short position upon the price’s return to the downtrend line.
Aggressive traders may join the corrective rally after the hourly chart establishes its own, short-term uptrend, posting two rising peaks and troughs, which may be in the form of a H&S bottom. So far, it has registered one peak and one trough.
Trade Sample
- Entry: 20,500 (see note below)
- Stop-Loss: 20,000
- Risk: 500 points
- Target: 22,500
- Reward: 2,000 points
- Risk:Reward Ratio: 1:4
Note: Entry at 20,500 — after it's retreated to form another shoulder, establishing a second trough, before posting the peak that would seal the short-term uptrend.
