By Pinchas Cohen
The end of NAFTA is no longer the scariest thing President Donald Trump could pull off. Now he threatens to shut down the government if he doesn’t secure the necessary funds for a wall on the border with Mexico.
Just as the Brexit vote created short-term shock in the market long before any obvious effects from actually leaving the EU, the abolishment of NAFTA is expected to send a shock to the financial system, causing potentially deep, rippling effects.
Consensus among economists maintains that NAFTA benefited North American economies and their average citizens, but harmed blue-callar workers of industries that became exposed to competition – a group that makes up President Donald Trump’s core base.
Should NAFTA be abolished (or even on concerns that it may be abolished) investors might seek opportunities in currency and commodity markets, which would be compounded with a spike in business hedging.
One of the greatest beneficiaries of such a market shift would be the company that operates the world’s largest options and futures exchange traded on the NASDAQ – the CME Group (NASDAQ:CME).

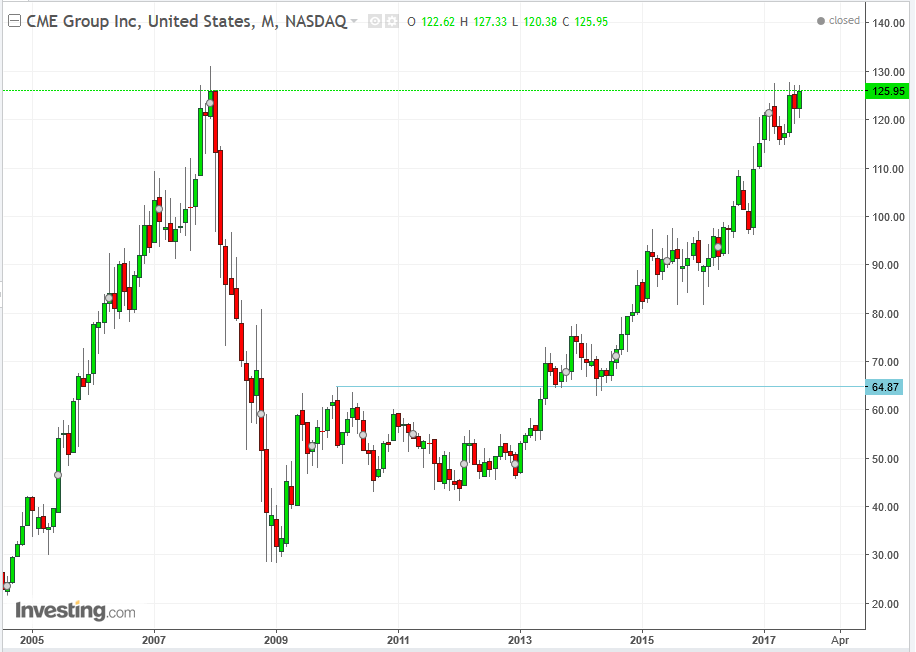
Since April 2014, the stock price more than doubled itself – as well as doubled the NASDAQ Composite performance – from $63 to under $128, where it’s been stuck since March. The resistance was the price’s all-time high of the $130 level reached on December 2007, before the crash.

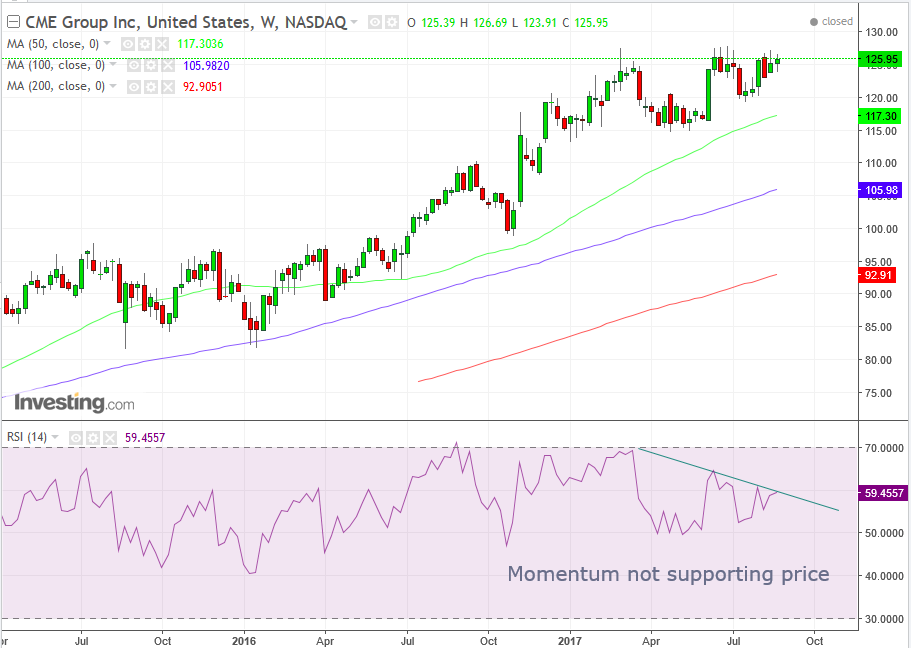
The weekly RSI has provided a negative divergence, as the February, $127 high was revisited in June and August, while the momentum waned.
However, should Trump persist in his threats to abolish NAFTA, and especially if he takes any action, investors will begin considering it more than another day in the Oval Office and take it more seriously. That could be the catalyst to reverse momentum and break through the $130 psychological barrier which is another catalyst.

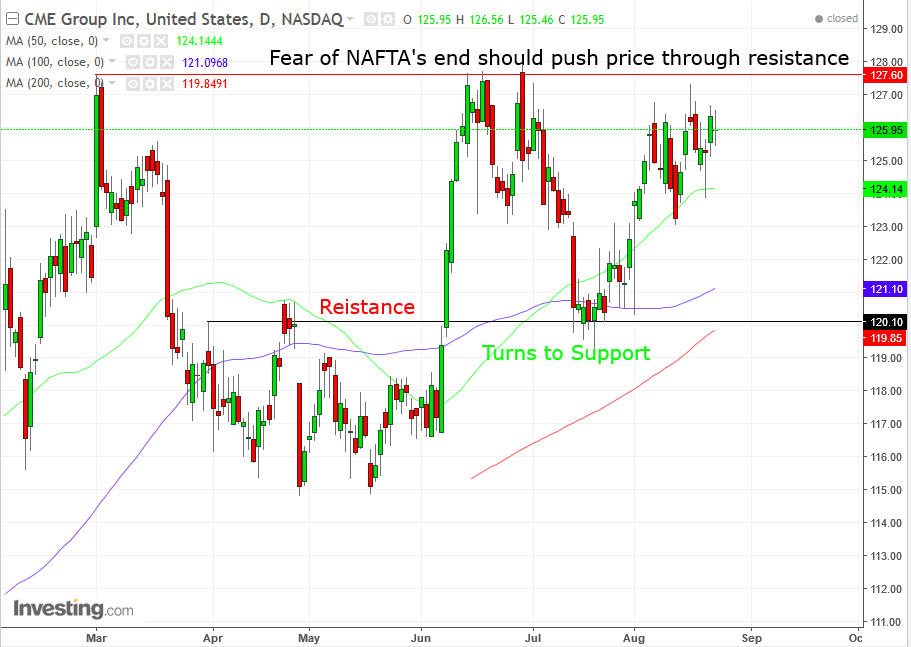
The August 16 peak of $127.35 failed to reach the March 1 peak of $127.60 and came even shorter on the more recent – and therefore more significant, as it’s fresher in investors’ minds – June 29 peak of $127.96. Furthermore, the last peak could not maintain its advance and the bears forced it all the way down, forming a bearish Shooting Star whose resistance has been respected ever since.
Trading Strategies
Conservative traders may want to sit this one out, as the price is between a rock (the all-time-high resistance) and a hard place (President Donald Trump).
Moderate traders may wait on a long with a decisive close – 1 to 3 percent, depending on risk aversion – above the shooting star, which would also be a close above all recent highs.
Aggressive traders may short, with a stop-loss above the shooting star and a minimum target of $125, psychological round number support, with further targets at $124, the 50 dma (green) $120, psychological round number support, and the 100 dma (blue) and 200 dma (red).
Once, the price finds a support, aggressive traders may take it back up. Alternatively, they may take it up after a close above the shooting star.
