Gold Continues To Advance Despite Interest Rate Hikes
After the dollar’s worst year since 2003, gold has been seeing its longest advance since mid-2011. The precious metal currently on its 12th day of gains. What’s most surprising about this dollar-weakness / gold-strength is that it's happening in the aftermath of three interest rate hikes in 2017 with another three projected by the Fed for 2018. This would normally strengthen the dollar and weaken the non-yielding asset that is gold.

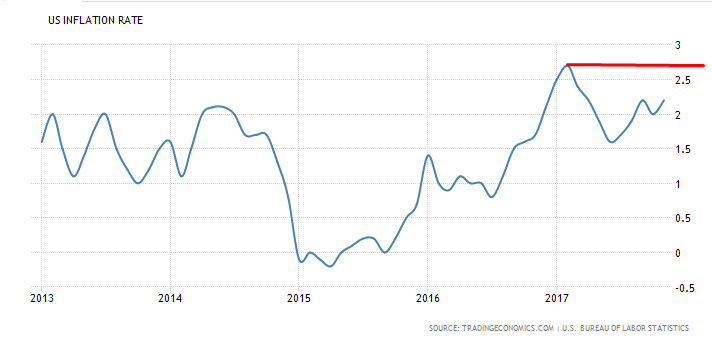
Are investors irrational or are they betting the US economy will not be able to resume growth when it continues to experience a persistently low inflation rate? While inflation has been moving in an upward trajectory since June, bottoming at 1.6 percent and rising to 2.2 percent, it is still half-a-percent lower than February 2017's 2.7 percent.
Frankly, we don’t know whether investors are acting rationally or not, but we're inclined to bet on the trend, counting on the statistical probabilities of supply and demand.

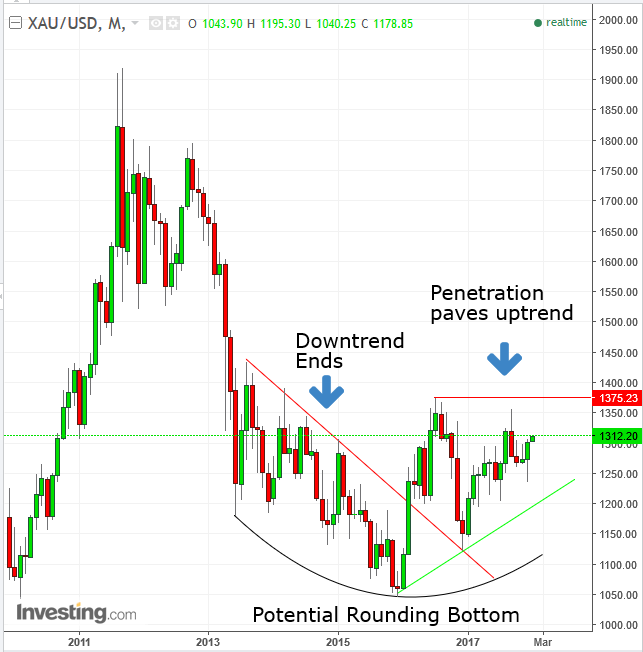
Gold has been forming a rounding bottom since 2013. Because of the pattern’s lack of sharp angles, it's difficult to determine at what point the pattern is complete.
Therefore, we broke the pattern into two:
- The first part of the pattern is the apparent downtrend (red line from August 2013, connecting the highs of the falling price until the apparent bottom on December 2015, at $1,045.85), which may have ended with an upside breakout on February 2016, confirmed when the resistance of the downtrend line turned to support, as the price bounced at this level on December 2016.
- The second part of the pattern is an apparent uptrend line (green line from the bottom). However, while there are two troughs in rising succession, there is only one peak on June 2016, at $1,375.23. A penetration of that price with a higher register would establish a rising trend. This may also complete the rounding bottom pattern.

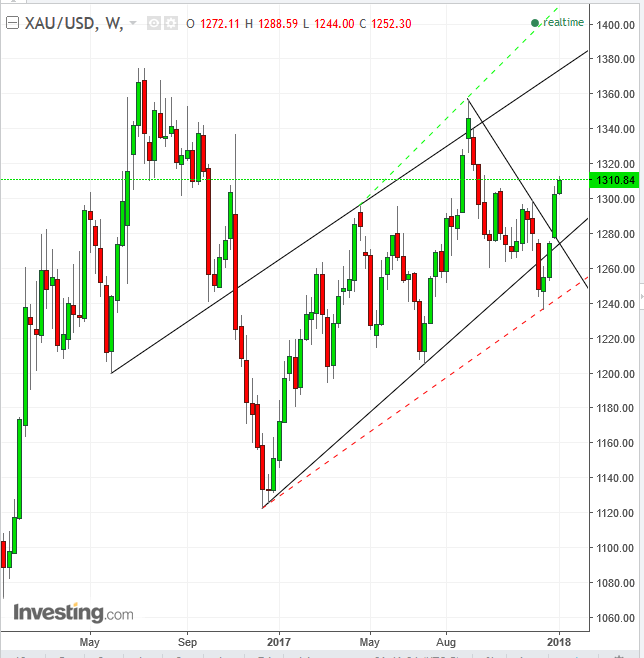
The price has been trading within a rising channel since December 16, 2016. Nearly a year later, on December 7, the price fell below the uptrend line/channel bottom support, putting its integrity into question. However, the current rally did not merely ascend back above the broken uptrend line/channel bottom but traversed above the downtrend since September 8 to boot, sending the price of the precious metal squarely back into its pre-existing, rising trend.
A few pointers about drawing trend lines: Note that we did not include the price action for the weeks ending between December 4 – December 18 (dotted red line). That’s because a new high (above the September 4, $1,357.58) must be registered to consider that a valid low. Also, we didn’t include the price action of the week ending September 4, the second peak of the rising channel (dotted green line).
That would distort an otherwise organized rising channel, in which both supply and demand rise in a balanced structure. Notice that we've connected the resistance line of the channel-top to the support line of May and October 2016, with the principle of the interchangeability of support and resistance once violated, as traders are presumably encouraged to trade in that direction, after the price moved that way.
Often, we have found that the balance between support and resistance may portray the most representative angle of the supply-demand balance.
Indicators
While both MACD and the RSI provided weekly buy signals, the RSI daily is oversold at 73.43, the highest since September, like the price.
Trading Strategies – Long Position
Conservative traders may enter a long position after the trend confirmed itself with a new, higher peak. Some more risk-tolerant traders may do so after a correction. However, the December fall below the uptrend line reveals the potential for volatility in the current market dynamic and it might be prudent to wait for the confirmation of a new peak.
Moderate traders wait for a correction toward the channel-bottom, a level which the 200 dma is guarding, currently at $1,271.54, and a bounce confirming its support with an up-day which covers the real body of the preceding down-day.
Aggressive traders may wait for a correction to the channel bottom without a bounce or for a correction to the 100 dma (blue), currently at $1,288.05, with a bounce.
Target: $1,357.58, the September 8 peak.
Asset Equity Management
Strictly speaking, in terms of market dynamics, there is the potential of a market correction to the December 12 low of $1,236.59. Therefore, it’s important to conserve equity with a healthy risk-reward ratio of minimum 1:3.
An aggressive trader who enters at around $1,300 enjoys a target of $57, allowing up to a $19 risk, as far as $1,281 for a stop-loss. By the time the price reaches there, it should already be above the channel-bottom, though far above the $1,236.59 December 12 low. That is the risk of trading and is factored as a cost of business.
On the other hand, an entry at the $1,270 level of the 200 dma provides an $87 target, which allows up to a $29 risk for a stop-low, as far down as $1,241, but still not quite enough to cover the potential of a retesting of the $1,236 low.
A moderate trader entering at the $1,275 level, after a bounce over the 200 dma, receives an $82 target, allowing up to a $27 risk of a stop-loss, as far down as $1,252.
A Word About Stop-Losses
Stop losses need not be stretched to their limit. The moderate trader may place it below the $1,270 level, both below the 200 dma as well as the psychological round number support for only a $5 risk, establishing a dreamy 1:16 risk-reward ratio. However, note that while you’re “saving” on the stop-loss by limiting this risk, you are increasing the risk of being stopped out. Everything is a trade-off. Only experience can help a trader find the strategy and type of risk that is best suited to his temperament and resources.
Which stock should you buy in your very next trade?
With valuations skyrocketing in 2024, many investors are uneasy putting more money into stocks. Unsure where to invest next? Get access to our proven portfolios and discover high-potential opportunities.
In 2024 alone, ProPicks AI identified 2 stocks that surged over 150%, 4 additional stocks that leaped over 30%, and 3 more that climbed over 25%. That's an impressive track record.
With portfolios tailored for Dow stocks, S&P stocks, Tech stocks, and Mid Cap stocks, you can explore various wealth-building strategies.

