The primary argument among bears and bulls amid the rally since March, the strongest for the Dow Jones in years, is whether the US is headed into a slow economic recovery, or a quick one. Each side has their own argument: that reopening economies will either create exponential growth, or they won't.
Over the weekend, Texas and Florida were the first two states to limit reopening their economies. Given that both are run by Republican governors—and Florida is a must-win for President Donald Trump’s reelection bid—it makes it easier for Democratic governors to backtrack on any lifting of restrictions.
If lockdowns remain in place, even partially, it will become more difficult to argue the case for a V-shaped economic recovery.
At least that is what we think investors seem to think, based on their trading habits.

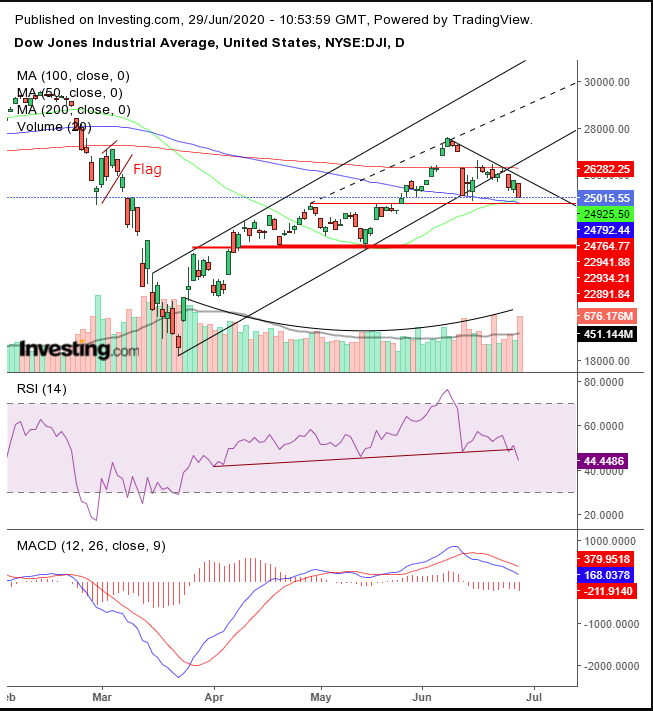
The Dow failed to reach the top of the rising channel that has formed since March, breaking below the 200 DMA, as it did during the panicked COVID-19-related drop in late February, when stocks sold off almost in a straight line. This showed at the time that there was no orderly distribution, but rather, it was a black-swan event. Note that the single upward correction within the February-March plunge—a rising flag, which is bearish—found resistance at the same 200 DMA.
The 30 compenent, mega cap index closed at session lows on Friday, showing there were no buyers at those levels that might have been willing to commit to that position over the weekend, while the resurgence in coronavirus cases raged on.
Volume diminished after the initial dead-cat-bounce, signaling that fewer traders were pushing the price higher. This means the move is not necessarily representative of a trend and may in fact be unsustainable.
Volume picked up with the drop from the June 8 high, signaling that supply was outpacing demand. Note the increase in volume and divergent decline in the price.
The MACD entered bearish mode when the short-term MA crossed below the long-term MA, confirming both the price decline and the volume spike.
The Relative Strength Index provides the same confirmation from the perspective of momentum. As far as the RSI is concerned, the price looks likely to fall below its April-May lows. But the RSI is not a crystal ball; it only reflects current momentum.
All three indicators, the price, MACD and RSI, suggest that, when the Dow fell below the 200-DMA and then subsequently found resistance there, which pushed it below the rising channel. The short-term uptrend is still officially intact, unless the price breaches the April-May lows under 23,000.
That doesn’t mean, however, that the index won’t first bounce off the April highs, where the 50 and 100 DMA converge, providing support.
Trading Strategies
Conservative traders would wait for the price to fall below the March lows, establishing a long-term downtrend, before considering risking a short position.
Moderate traders might enter a short position after the index falls below 24,760.
Aggressive traders would short with a close around 25,000, the location of the April highs and the June lows. They could also short upon a return toward the broken channel.
Trade Sample
- Entry: 26,000
- Stop-Loss: 26,300 – above the 200 DMA
- Risk: 300 points
- Target: 23,000
- Reward: 3,000
- Risk-Reward Ratio: 1:10
Note: This is a trade sample, not a prophecy. It is merely a picture of what parameters to consider when drawing a coherent trade plan. You need to fit the specifications to you, based on budget and temperament. Not every trade wins. Not every trade loses. Don’t hate us or love us because of this one trade.
