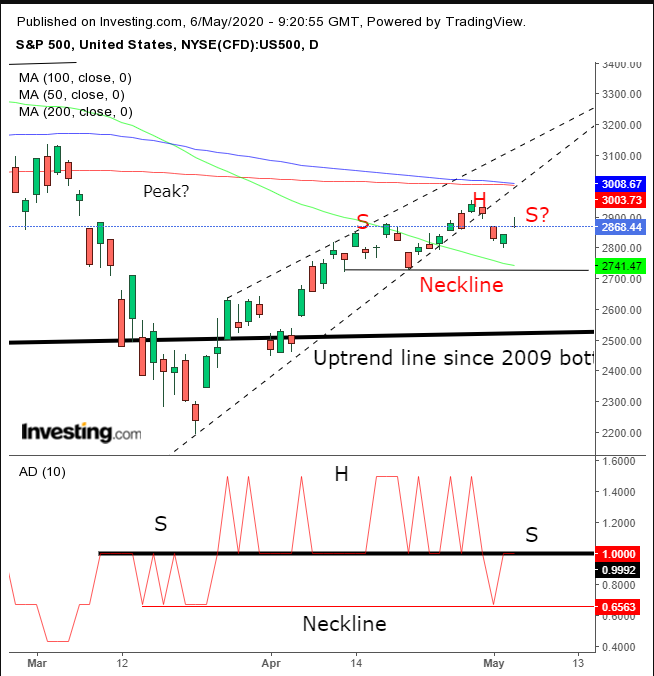
US futures are on the rise at time of writing, promising another day of rallies for the underlying indices when Wall Street opens later on Wednesday. When this occurs, it would be the third straight day of gains for the S&P 500, as well as for the other major US benchmarks. In the current, highly uncertain market environment, that's a feat worth noting.
Even the warnings yesterday from two Fed members that (1) what was done so far by the central bank is not enough, and (2) that the Federal Reserve doesn't really know whether anything will be enough, since all this is nothing more than an “experiment," hasn't dampened investor sentiment. Neither has a potential rekindling of the US-China trade tiff, if not a cold war, between the two strongest economies on the planet.
Notwithstanding the broad array of headwinds, equity bulls remain undaunted. They've only slowed the pace of their advance. But technicals could be sending a signal that demand is deteriorating.

We recently noted that a bearish wedge (dotted line) was forming on the benchmark index. Yesterday’s rally completed a gravestone doji, a bearish trading pattern, though it didn’t follow a significant advance which would have provided a meaningful signal.
Nevertheless, if confirmed with a lower close, it would increase the odds that we have a small H&S top development, directly under the feet of bulls, who remain hopeful that reopened economies will potentially take prices to record highs.
A completed H&S top would confirm the preceding bearish pattern, whose target is a retest of its bottom, the March low. And so much rides on that low.
If it breaks, we will have a bonafide, long-term downtrend on our hands, with two peaks and two troughs in a descending formation, after having fallen for the second time since late March. Note that the uptrend line was never penetrated, since the bottom that followed the ominous 2008 crash.
The Advance-Decline line found resistance by the 1.00 level, a proven support and resistance level since just before the March bottom. As well, the Advance-Decline line may be forming its own H&S top.
Also, the 50 DMA crossed below a declining 200 DMA, triggering a death cross, which increases the bearish implications, amid the rising wedge advance even as the price was rising.
Trading Strategies
Conservative traders would wait for a new low to register beneath the March bottom, to short, or for a new high above the February high, to buy.
Moderate traders may enter a short upon a completion of the H&S top, below 2,700.
Aggressive traders may enter a contrarian trade, shorting the rally, counting on the H&S top as a continued bearish development after the rising wedge.
Trading Sample
Entry: 2,900
Stop-Loss: 3,000
Risk: 100 points
Target: 2,500 – round psychological number and implied target of H&S
Reward: 400 points
Risk:Reward Ratio: 1:4
