The single biggest theme in markets this year is the post-pandemic recovery after the most catastrophic economic disruption in modern history. Even during WWII, the economy didn’t stop. On the contrary, it created jobs, and lots of them.
More specifically, the issue is identifying the forces that will drive the recovery. Will there be inflation or not? If yes, will it slow the rate of growth or not? Or will inflation, in fact, compound growth, as rising prices will allow companies to grow faster, which will in turn allow them create more and better paying jobs?
Market analysts across the globe have differing opinions. So, we won’t presume to offer an opinion. We will only discuss the supply and demand of stocks that will be affected by the recovery.
There are industry sectors that gain more during economic expansions, and there are those that benefit from economic contraction. To that effect, market sectors have been roughly divided into two segments—growth stocks that outperform during contraction and value stocks which provide superior returns amid expansion.
The stocks that provided investors with the best results during the lockdown were predominantly technology stocks, especially the larger cap ones. Companies that underperformed over the same period were value stocks.
Over the last few months the market has been going back and forth on the “reflation trade,” which benefits value or cyclical stocks—those that perform better when the business cycle picks up.
We think the reflation trade may be about to take a step back in favor of growth stocks.
The Russell 2000 best represents the reflation trade, as it includes many US domestic firms which suffered significantly during the coronavirus lockdown and therefore provide the best value as the economy reopens and returns to business.
This year, the small-cap benchmark has gained 13.9% YTD. On the other hand, the tech-heavy NASDAQ 100, which has tended to possess a negative correlation with the Russell 2000, rose only 6.3% YTD.
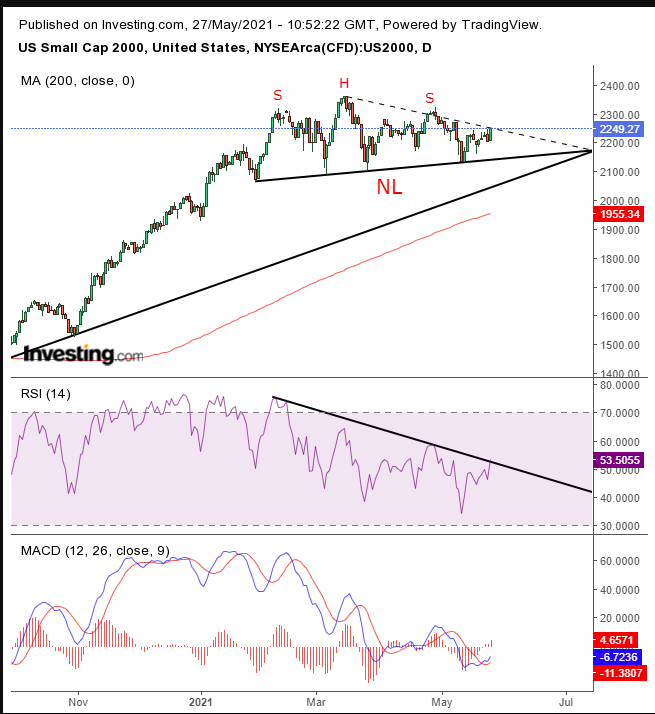
Now, let’s see what that looks like on the chart.

The small-cap index has soared over 50% between its October low and March high, the head of a H&S top. When the index fell ahead of Mar. 5, almost to the previous low of Jan. 29, it was a signal that trouble was brewing.
The next peak was only a 1.75% increase, before the index fell again to within 0.7% of the previous March low. Then the alarm went off when the price peaked on Apr. 29, at a lower level than the previous peak on Mar. 15, upsetting the rising peak-and-trough formation. Then, yet again, the price fell until May 12, within 1.5% of the previous trough registered on Mar. 25.
This pattern demonstrates that demand is running on fumes. If the price falls below the pattern’s neckline—which will soon meet up with the rising trend line which is supported by the 200 DMA—since the 2020 bottom it will complete a bearish pattern. This pattern will likely trigger a chain reaction of stopped out long positions and triggered short positions that will push the price yet lower.
Of course, we don’t know that the price will provide a downside breakout. The index could blow out the pattern, forcefully reversing positions, catapulting higher. The MACD has indeed provide a buy signal. The RSI, while having provided a negative divergence, when momentum between February and March, against the rising price, tested the possibility of crossing over its downtrend line.
Therefore, what we’re actually saying is if the H&S pattern completes, it will be a strong bearish signal.
Trading Strategies – Short Position Setup
Conservative traders should wait for the pattern to complete, for the price to fall below the uptrend line and the 200 DMA, followed by a corrective-rally that finds resistance.
Moderate traders would also wait for the price to clear all supports, perhaps even wait for a return-move for a better entry, if not for further confirmation of supply.
Aggressive traders could short at will, according to a trade plan that meets their timing, budget and temperament.
Here are three examples:
Trade Sample – Fast Trade Within Pattern
- Entry: 2,250
- Stop-Loss: 2,260
- Risk: 10 points
- Target: 2,200
- Reward: 50 points
- Risk:Reward Ratio: 1:5
Trade Sample – Longer Trade Within Pattern
- Entry: 2,300
- Stop-Loss: 2,325
- Risk: 25 points
- Target: 2,200
- Reward: 100 points
- Risk:Reward Ratio: 1:4
Trade Sample – Longest Trade Including Breakout
- Entry: 2,300
- Stop-Loss: 2,325
- Risk: 25 points
- Target: 2,000
- Reward: 300 points
- Risk:Reward Ratio: 1:12
