By Pinchas Cohen
Sell The Rumor...And Sell High
“Buy the rumor, sell the news” is one of those Wall Street sayings that will never turn into a cliché, as it always remains fresh.
In today’s market, however, we might turn that phrase on its head: “Sell the rumor, buy the news” as rumors rise on billionaires and money managers with their feet ready on the breaks.
There is no scarcity of fundamental reasons: geopolitical risk (Trump meets Kim Jong-un, need we say more?), historically high valuations on an economy that refuses to take off, while European, Asian and emerging markets offer far more attractive multiples, and far faster growing economies, to boot.
Another saying on Wall Street that will never get old is “Buy low, sell high.” Obvious, isn’t it? Well, the fact is that the general public doesn’t get involved in the stock market until they see continued rallies on the news. But if the unsuspecting public is buying, who’s doing the selling?
Smart money. It pays to pay attention to smart money.
Be Smart – Follow the Money
Stock markets move in cycles. After the market crashes, the public sells their stocks for a fraction of what they paid for it to institutions that are buying something they sold the public at a much, much higher price. And after the market gets inflated – when the public is pulled back in, again – smart money sells it to the dumb money, again. When the dumb money puts in everything it has and demand dries up, selling outweighs buying, which causes a decline. That scares some, adding to the selling pressure. Soon enough, the snowball effect takes everyone into a panic, and they – again – sell everything for next-to-nothing to…you guessed it…smart money.
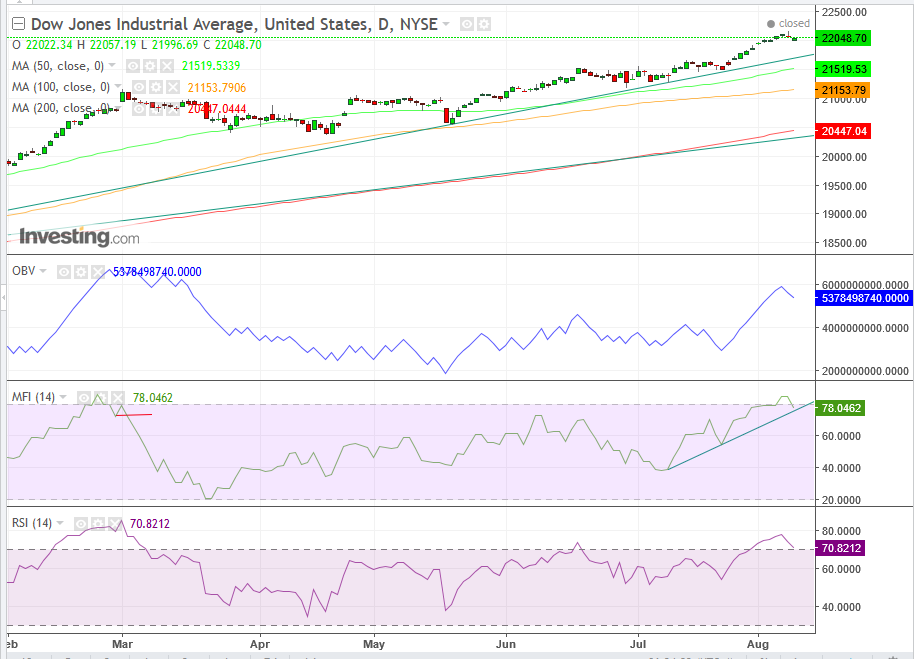
The Dow Jones Industrial Average recorded yet another new, all-time-high, on Tuesday, at 22,179.11, it’s 11th in a row.

However, it couldn’t hold onto its gains and closed below Monday’s close and even below Monday’s open. Additionally, Tuesday’s low was lower than Monday’s low. The trading pattern of that day formed a bearish Shooting Star. This demonstrates that the bulls showed their hand and made a run for it, but the bears pushed them all the way back, demonstrating a stronger hand.
Sure enough, yesterday the price opened on a falling gap, and even though it pared some of those losses with an advance, it closed beneath the Shooting Star’s trading range. In a total sign of weakness, the price couldn’t even touch the lowest price of the previous day.
The leading RSI momentum indicator has provided a sell signal, when it turned down from its most overbought level since the beginning of March, where it predicted the more than 3.5 percent decline in less than 4-weeks.
The On Balance Volume which measures positive and negative volume, is turning down after reaching its highest level since mid-March, two weeks after the RSI gave the sell signal, before the 3.5-percent decline. This indicator is considered the “smart money” indicator, which leads the volume.
But if you want to track the cold, hard cash, look at the Money Flow Index, which measures money flows via the stocks’ prices and volume to measure trading pressures. Sure enough, you can see that it too reached its highest level since the beginning of March, together with the RSI. However, then it actually beat the “leading” momentum RSI indicator, by reaching its highest level on February 23 and forming a lower peak on March 1, providing a decisive sell signal when crossing below its February 28 trough on March 2.
Even if the stock market doesn’t actually crash, it’s gotten pretty far away from its uptrend line since February 2016 and even 2 percent away from its more recent, steeper, November 2016 uptrend line. All of which prime a correction.
Trading Strategies:
Conservative traders would probably not short a stock within an uptrend line.
Moderate traders might short the Dow, upon an upward correction toward the Shooting Star’s all-time high, 22,179 resistance.
Aggressive traders may short it now.
Target Prices:
- 22,000 – which is round-number psychological support
- 21,750 – the November uptrend line support, guarded by the 50 dma (green)
- 21,150 – the 100 dma (orange) support
- 21,000 – the round-number psychological support
- 20,000 – the major round-number psychological support, guarded by the major 200 dma (red)
