No election is ever like any other. It’s impossible to compare social, political and economic climates in different eras. However, we have had one constant—a stock market indicator that, up until now at least, has been providing consistent, accurate results.
While this indicator is remarkably simple, in our view it appears to illustrate the overall mood at the time.
By that measure, when US stocks were up in the three-month period before a presidential election, the incumbent or his party remained in office in 20 out of 23 contests, or 87% of the time. Since 1984, the same metric has worked 100% of the time.
But why would an equity move of 1% in either direction predict the next leader of the free world so consistently? Statistically speaking, the number of events is not representative, but there is another element beyond the math. It’s the psychology.
Most analysts use a three month period from July 31 until Oct. 31 as the gauge. As such, they've already forecast a Biden win, since the preceding rout during September and October pressured stocks into negative territory—down 0.87% for the S&P 500 Index.
However that timeframe may have been a mistake. Voters aren't financial analysts, and the analytical three-month period doesn't take into account that many people don't decide who they'll vote for till right before they cast their ballot. Otherwise, why would candidates still be campaigning? Candidates continue right up to election day because they know people change their minds. Which is why, for this metric we should consider stock prices up until election day.
As of yesterday’s closing prices, the S&P 500 was +0.5% since its Aug. 3 closing price, and if futures are a signal for today’s performance, the indicator will provide a green light for President Donald Trump for another four years.
Of course, this isn't a hard and fast indicator, especially during a year when so many early ballots have already been cast—a record 97 million, which is over two-thirds of the total 2016 vote. Using that earlier timeframe, of votes submitted before election day, the indicator, with stocks in negative territory until yesterday, could have been accurately signaling a Biden win instead.
Still, we won't know how reliable this metric will be till all the votes are counted. And that could take some time.
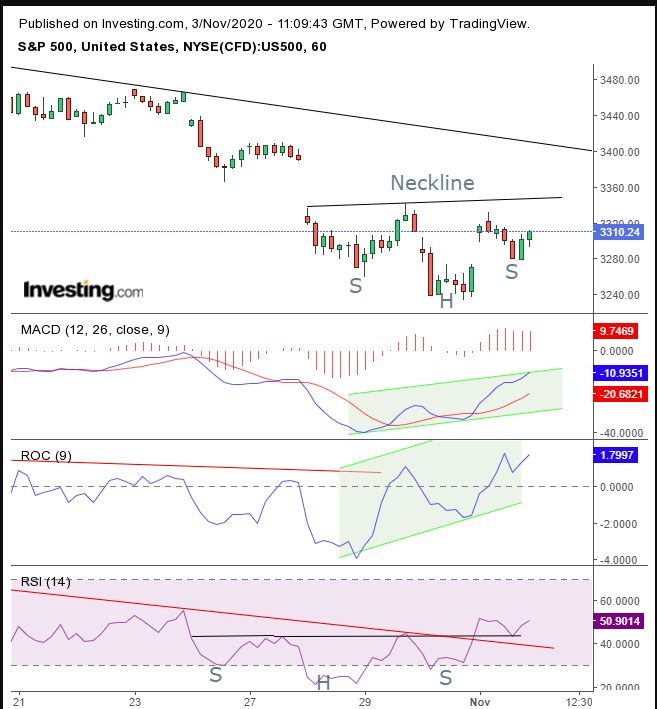
However using technical charts, we can at least forecast which way the SPX may be headed next. And the hourly chart shows signs of a continued rebound.

The preceding selloff came within 0.75 percent of the Sept. 24 low. If it falls below this level, it will have established a downtrend. To be sure, the fact that the on Oct. 12 the index peaked below the Sept. 2 high is worrisome. However, an almost 9% drop could have shaken out weak hands and made stocks attractive again.
The benchmark index has been trading within a H&S bottom, with the RSI already completing it ahead of the price. Also, the ROC—another momentum-based indicator—suggests an upside breakout, as does even the lagging MACD signal which is based on price average comparisons.
A cross above 3,350, will have completed the H&S bottom, setting up a chain of events that could lead prices higher. Initially, a short squeeze would infuse the market with forced demand by traders who must quickly buy borrowed shares from their brokers. The added demand boost would send prices another leg higher, triggering long positions as they jump, attracting additional speculators for another leg up.
Trade Strategies – Long Position Setup
Conservative traders should wait for the pattern completion with an upside breakout whose penetration reaches at least the 3,400 level, where it will likely find resistance, setting it up for a return move. These traders would wait for further evidence of the bottom, with the price bouncing off the pattern.
Moderate traders would wait for the same pullback as their conservative peers, for an entry closer to the support, not necessarily for further confirmation.
Aggressive traders may risk a small long position now, to beat the herd, who’d leave them with slim pickings. However, along with the higher reward potential, so goes the risk. Therefore, the more aggressive the trade the more important is a solid, tight plan that traders must adhere to. Here’s an example.
Trade Sample
- Entry: 3,300
- Stop-Loss: 3,275
- Risk: 25 points
- Target: 3,400
- Reward: 100 points
- Risk:Reward Ratio: 1:4
Author's Note: This is a trade sample, not a prophecy. Trading only works if you limit your losses and run with your wins. That’s why a clear and sensible trading plan is a must for any aspiring trader. Otherwise, you’re just a gambler.
Also, it’s imperative to understand that not all trades are fit for every trader. You need to understand the basic points of a trade equation and fit them to your personal circumstances, including your timing, budget and temperament. It will take you time, patience and money to work all this out. If you’re not willing to make that investment in yourself as a trader, don’t bother with the actual trades, as the odds are firmly against you.
