Procter & Gamble (NYSE:PG) is due to release corporate results Thursday before the market open, for the fiscal quarter ending December 2019.
We expect EPS of $1.37, unchanged from the previous quarter, up from the $1.25 for the same quarter last year, while revenue is anticipated to $18.41 billion, up from the $17.45 billion of the previous quarter which is even higher than the $17.16 billion for the corresponding quarter last year.
P&G earnings have beaten estimates for 15 straight quarters and revenue for five. Will the streak continue? And if it does, why has the balance of supply/demand traded like it may not? Though we can’t know for certain that the collective investor does not expect an upside surprise for these earnings, this could be a sign that the stock is running out of steam.

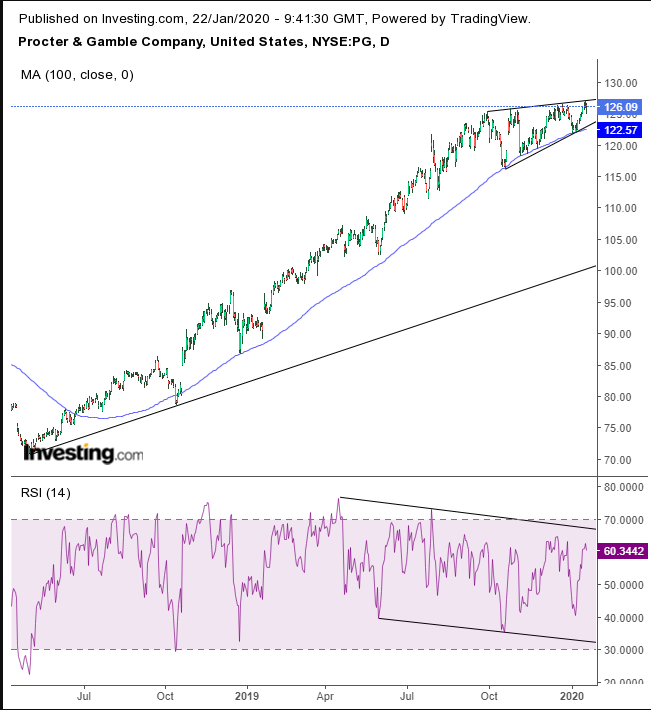
Shares have been trading within a converging pattern since Oct. 1 with an upward bias. This is called a rising wedge. It demonstrates that while a stock has indeed been rising, the rate of the climb has been slowing.
This flags the possibility that investors may begin to lose patience at not seeing the same kind of returns they'd become accustomed to before the pattern emerged. This is underscored by the 100 DMA as a moving uptrend line that provides a fair measure of the uptrend, as well as marking the bottom of the rising wedge as a significant technical pressure-point.
The current share price is as about 25% above its uptrend line since the May 2018 bottom. Compare that to the Dow Jones Industrial Average, its index. It is only about 7% above its uptrend since the nearest bottom in December 2018. If we consider the uptrend line as the normal rate of ascent throughout a period, Procter & Gamble’s spike is almost four times as sharp as that of the index on which it's listed, giving it a lot of room to fall in order to return to a sustainable rally.
Note the negative divergence between the RSI’s falling channel and the rising wedge of the stock, another bearish indicator.
Trading Strategies
Conservative traders would wait for a downside breakout, with at least a 3% penetration to avoid a bear trap, then wait for a pullback to demonstrate resistance by the bottom of the wedge.
Moderate traders would wait for a downside breakout, with a minimum 2% filter, to avoid being knocked out of position by a whipsaw, then wait for the expected return move for a better entry, not necessarily for proof of a reversal.
Aggressive traders may short now, providing they understand the pattern is not complete before a downside breakout and are willing to accept the risk.
Trade Sample
