by Pinchas Cohen
As readers know, our long-term view of oil is bearish.

2 Reasons Not To Enter A Long Position
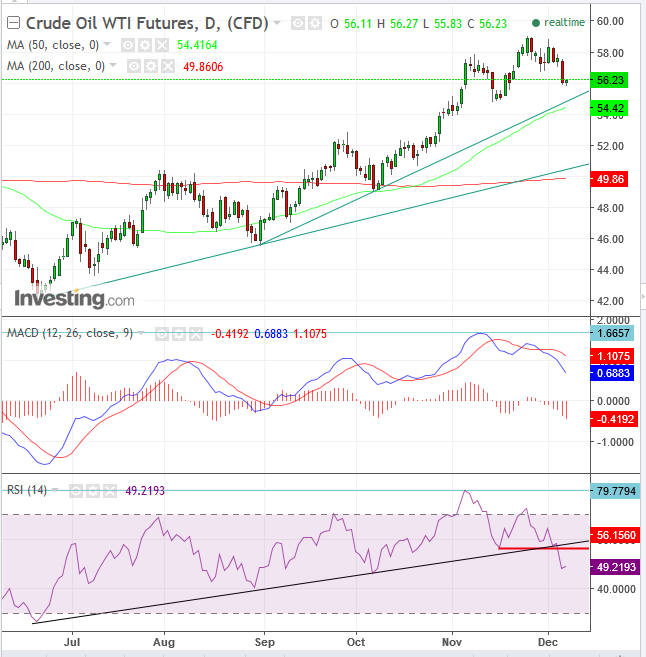
While our midterm view is still bullish—as the price is traded within a trend still dominated by demand—and the two most recent uptrends (one, from August 31, another from June 21) are “guarded” by 50 dma (green) and 200 dma (red), respectively, suggesting a presumed demand, we wouldn’t enter a long position, because of two indicator-based sell signals.
(1) The MACD executed a sell signal when its faster moving average (because it includes a shorter period of data, rendering it more sensitive to price changes), in blue, crossed below its slower moving average (because it includes a longer period of data, rendering it less sensitive to price changes), in red, suggesting price momentum is slowing down.
What is especially poignant about the crossing is that it follows a MACD read of 1.66, the highest read since June 1, 2016 when the 98 percent leap from February’s $26.05 ended 8 days later on June 9, with the intra-day high price of $51.67. The extreme MACD read that preceded that top was followed by a 24 percent decline in less than two months, until August 3, with the intraday low of $39.19. It took oil bulls another 4 months, until December, to achieve a higher peak.
(2) The RSI executed a sell signal when it fell from a 79.74 read on November 6, the highest daily read in the last decade. Like with the MACD crossing from an extreme level, this potentially renders the RSI sell signal its most significant signal in the decade.
The RSI also produced two negative divergences with the price of oil, namely:
- When it fell lower than its previous low of November 16, while the price was still higher than the previous low, registered on November 14, and
- When it crossed below the RSI uptrend line since June 21.

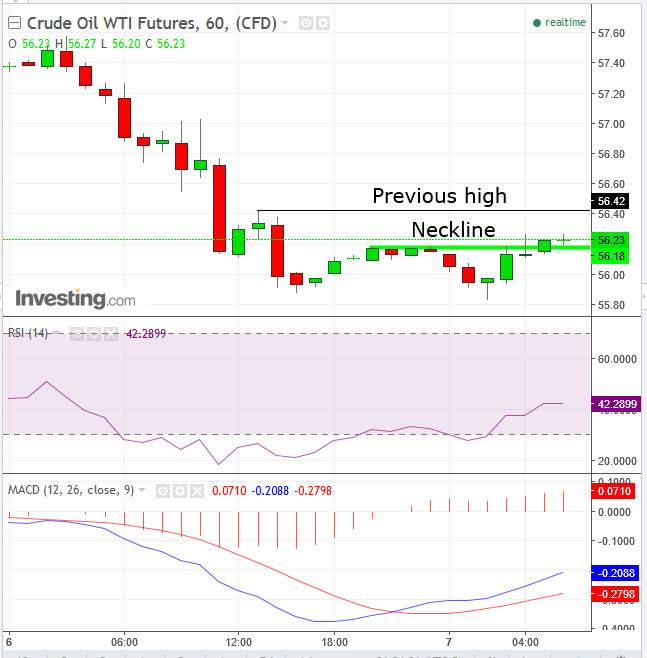
The short-term price of oil is forming a potential, small double-bottom supported by buy signals, both by the MACD and RSI, as they cross above in mirror image of their daily chart, from their lowest reads since November 15 and November 14, respectively. The extreme oversold condition, followed by a bullish cross, signals the price may resume moving higher.
At 6:00 EDT, the price closed above the neckline, the line that connects the double-bottom highs. However, the bearish Shooting-Star, completed at 4:00 AM provides resistance at its $56.27 high. A close above that would increase the odds of a bonafide breakout and avoid a bull-trap.
Trading Strategies
Long Position
Conservative traders may wish to avoid this trade because of the conflicting signals, elaborated above.
Moderate traders may wait for a close above $56.42, the previous high, registered yesterday at 13:00 EDT. Depending on risk aversion, they may wait for a return-move to the neckline at $56.18 and maybe for a confirmation of its support with a bounce above the price action of the previous down-hour.
Aggressive traders may wait for a close above the 4:00 shooting-star.
Stop-Loss
- Below $56.18 – neckline
- Below $56.00 – round-psychological number.
Target
- $56.42 – previous high at 13:00 yesterday
- $57.00 – round-psychological number and proven resistance, forcing the price down yesterday at 5:00 and 6:00 EDT.
Risk-Reward Ratio
To increase chances of success, maintain a risk-reward ratio of minimum 1:3, in which even one loss within three gains leaves you even, minus the cost of trading.
Example:
Entry: $56.16, upon a return-move to the neckline
Stop-Loss: $56.15, 3 cents below the neckline = $0.3 risk
Target: $56.42, the previous level at 13:00 yesterday = $0.26
Risk-Reward Ratio: 1:8
