by Pinchas Cohen
While the S&P 500 Index made its 59th record of the year and Bitcoin has soared more than 1,500 percent this year, the Bloomberg Commodities Index plunged 4.2 percent in the past month, setting it on course for its sixth year of losses out of seven.
A decline is always followed by the question of whether it’s a correction after a histrionic rally, a buy-the-dip opportunity, or the onset of a bear market, the leading signal for a weaker economy ahead. The answer when commodity prices fall is connected to the fate of China’s economy.
The Asian giant's environmental and financial regulations are widely expected to slow its market and therefore its economy in 2018. A slowing Chinese economy means the world’s number one user of industrial metals will dry up demand, leading to widespread and consistent selloffs.
Nickel Takes The Brunt Of The Commodity Fall
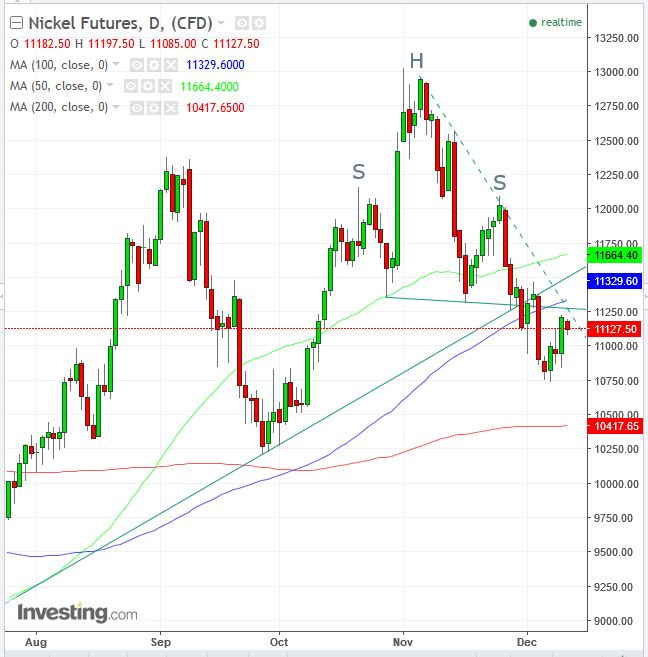
Nickel has been taking the brunt of slowing demand for base metals, as the electric car battery frenzy wore off. Nickel has fallen 17.5 percent since its November high, while the Bloomberg Commodity index fell 5 percent in the same period.

On November 30, we published analysis with trading strategies for nickel, both on the possibility of a H&S top completion or on its failure, and a resumption of the current uptrend which is still intact. The reversal pattern did complete, with a downside breakout, both of the pattern and its uptrend line since July. While this simultaneous penetration at the exact same price level forms our bearish view, the trend is still officially up, as all peaks and troughs are in a rising succession.
While the price crossed below both the 50 dma (green) and 100 dma (blue), strengthening our bearish view, the 200 dma (red) is “guarding” the former trough of 10212.50, posted on September 27. When one technical factor coincides with another (like the downside breakout of the H&S and uptrend line is at the exact same price level) it confirms what in this case is a support.
The neckline penetration satisfied the most conservative filter with a deep 4.5 percent decline. Since then, it has risen on a 4.5 percent return-move, stopping 0.40 percent below the neckline, and now it’s falling again. This provides an ideal entry, as the return-move, perhaps completed, averts whipsaws, which can wreak havoc on a trader’s equity.
Trading Strategies – Short Entry
Conservative traders would wait for an actual trend reversal, when two peaks and troughs would register in a declining succession. So far, both last peaks and troughs register higher. A register of a price lower than the former trough of 10212.50, posted on September 27, would probably include a lower peak than the 13032.50 trough posted on November 1, completing the beginning of an official downtrend.
Moderate traders, who rely on the H&S completion compounded by a cross below both the uptrend line since July and the 50 and 100 dma, may wait for a confirmation of the neckline’s integrity, with the price posting lower than the prior daily advance. Should yesterday’s gain be the last up-day, a close at 10947.00 would provide that confirmation.
Aggressive traders may enter a short position right now, absent a neckline confirmation, content with the potentially completed return-move.
Asset Management
A trader must combine his stop-loss and target to achieve a minimum of 1:3 risk-reward ratio, to increase his chances of overall success to be able to cover losses and reap a profit.
Stop-Loss, (or Presumed Supply):
- 11280, neckline
- 11330, 100 dma (blue)
- 11470, above the December 4 high, the former bulls’ attempt to rally above the neckline and the short-term downtrend line since the pattern head on November 6 (dotted).
Targets, (or Presumed Demand):
- 10742, December 7 trough and depth of neckline penetration
- 10212.50, September 27 trough
- 9600, implied target based on pattern height and the playing out of the market psychology
Example 1 – Closest Stop-Loss Vs. Closest Target
- Entry: 11132
- Stop-loss: 11280, risk: 148
- Target: 10742, reward: 390
Risk-Reward Ratio: 1:2.6
Conclusion: okay, but not great. Aim higher, for a minimum 1:3 risk-reward ratio in your favor.
Example 2 – Farthest Stop-Loss Vs. Farthest Target
- Entry: 11132
- Stop-loss: 11470, risk: 338
- Target: 9600, reward: 1532
Risk-Reward Ratio: 1:4.5
Conclusion: Excellent ratio
Note: of course, you can mix and match any combination of stop-loss and target, provided you ensure a minimum of 1:3 risk-reward ratio.
