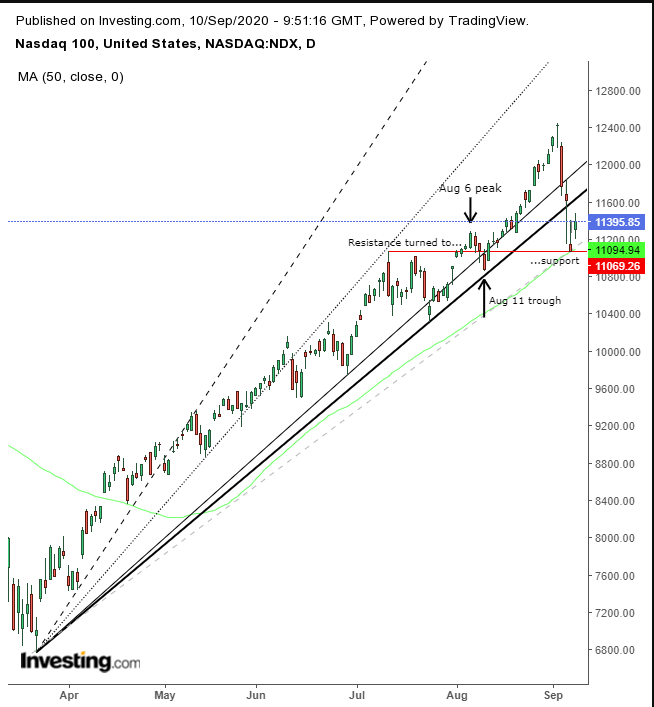
Following an 11% tumble in just three sessions, as tech stocks—including the highest-flying FAANGs—were dumped by investors, the NASDAQ 100 jumped 3% higher on Wednesday. It was the biggest gain for the technology-heavy index since April.
According to Mike Lewis, head of America's cash equities trading at Barclays, as quoted in the Financial Times, "activity in the options market may have been responsible for a portion of the move in volatility heading into the sell-off we just witnessed."
In Lewis' view a recent reduction in options price volatility suggests:
“The sell-off is likely done—confirming a correction rather than a reversal."
Nonetheless, global momentum has slowed today, with futures contracts on the NASDAQ wavering this morning, though they were lower at time of writing.
Of course, one can't help but wonder if technicals are corroborating those fundamentals.

On Wednesday, the index found support at the July highs. The fact that the 50 DMA met the day's price reveals the significance of this position. Indeed, we still see there's demand there.
After the 11,000-level provided a resistance in July, once that selling pressure was penetrated, it flipped to a support on the premise of a technical market dynamic—bears who, in early August, expected the price to fall from that level, as happened twice in July. Instead they were forced to cover shorts at a loss, which drove the price higher.
The painful lesson was taught to bearish traders by the bulls, whose positions were reinforced after they made the right bet on the index. As well, those sitting on the sidelines finally recognized a viable position and opted in.
This presumed wide support helped the price produce an inverted hammer on Tuesday, whose bullish potential could signal that if the price rises the following day it would create a short squeeze. This was confirmed by Wednesday’s higher close.
The activity of those two days may have completed a three-day Morning Star, foretelling a sunrise. Strictly speaking, the first candle should have had a long real body and the third should have penetrated deeply into it.
Instead, the first candle had a small real body, but because the second candle was so much lower, and the third day’s price did have an exceptional rebound, we consider this pattern to possibly have the same dynamics as a textbook Morning Star. The idea is that bulls have wrested control from bears.
With those details cleared up, its time to take a step back and see how they fit into the bigger picture.
The price fell yesterday below the uptrend line since the March lows. While that’s the first sign of a potential reversal, not every time this happens does it become a downleg.
Note how many lines had to be redrawn as prices kept forcing their way higher since the March bottom. For all we know, we might have to redraw the trendline to include the recent rout before the tech benchmark makes yet another new high. This trading pattern occurs when a rally, at first exuberant, becomes more moderate over time.
We don't worry much about trendlines, which are subjective and have meaning predominantly to technicians who follow them; hence the price-response to them is limited.
We are much more concerned with peaks and troughs, the very essence of what defines a trend. These are constant.
They don’t change according to the angle over time but rather are fixed according to the price. Therefore, even non-technical analysts are aware of them. If an investor remembers that he gained or lost at a certain price, that knowledge may have an impact on his decision making going forward, whether s/he is aware of it or not.
So, while the peak and trough formation remains within an uptrend, the decline fell below the previous peak on Aug. 6 and dipped almost to the preceding, Aug. 11 trough. While that isn't considered a reversal, it demonstrates the weakening of the trend. Even if the price does not go lower, the falling price could have been part of a top formation.
Still, the current pattern, and its location, suggests the odds are for at least another bounce over the next few days, if not weeks.
Trading Strategies
Conservative traders would only consider participating in this trade if prices made new highs on strong volume.
Moderate traders may consider a small position if the price retests Tuesday’s lows, to limit exposure.
Aggressive traders may trade once they found a good entry point that would allow them a positive risk:reward ratio that suits their budget and temperament. Here’s an example:
Trade Sample – Long Position
- Entry: 11,250
- Stop-Loss: 11,000
- Risk: 250 points
- Target: 12,250
- Reward: 1,000 points
- Risk:Reward Ratio: 1:4
Author's Note: The name of the section above is “trade sample.” As such, it doesn’t represent the analysis. There are other ways to make this trade, according to timing, budget, character and temperament. What is essential is consistency and discipline. Winning or losing individual trades doesn’t turn you into a successful trader or not.
You only know what works for you personally after trading sufficiently to create statistical findings. That requires consistency and discipline. Also, you can’t develop these statistical results if you don’t understand what moves markets and how the price behaves so that you can respond accordingly.
Trading – like any other profession – is not easy money. It takes time, focus, discipline, effort and funds. If you don't have all these, trading is simply not for you.
