This article was written exclusively for Investing.com
They say it is the reaction to news that is always more important than the news itself. So, while Thursday’s earnings results from some of the technology giants seemed decent, the fact that their share prices fell is what makes me wonder whether we will now see a bigger correction in the sector, and, in turn, the NASDAQ 100.
NASDAQ futures fell first thing on Friday after quarterly earnings results from technology heavyweights Apple (NASDAQ:AAPL) and Amazon (NASDAQ:AMZN), as well as social media stalwarts Facebook (NASDAQ:FB) and Twitter (NYSE:TWTR), failed to lift the mood.

Investor sentiment was already hurt by the resurgence of coronavirus and new lockdowns across Europe. Uncertainty related to the Nov. 3 US presidential election, as well as momentum selling also added to the pressure. However, at the time of writing, European indices and US futures were coming off their worst levels.
It remains to be seen whether the recovery will hold given that it is possible more lockdown measures could be announced over the weekend, and this could potentially cause futures to gap lower at the Asian open next week.
The fact that some tech leaders raised concern about the outlook for the sector will not go unnoticed by forward-looking financial markets. Investors have until now been piling into growth stocks, but now some will undoubtedly think twice about investing in these markets until there is a sizeable correction. So, there is a possibility that the mighty NASDAQ may extend its correction further, as froth is removed from some of the technology names which have disproportionately surged higher since lockdown in March.
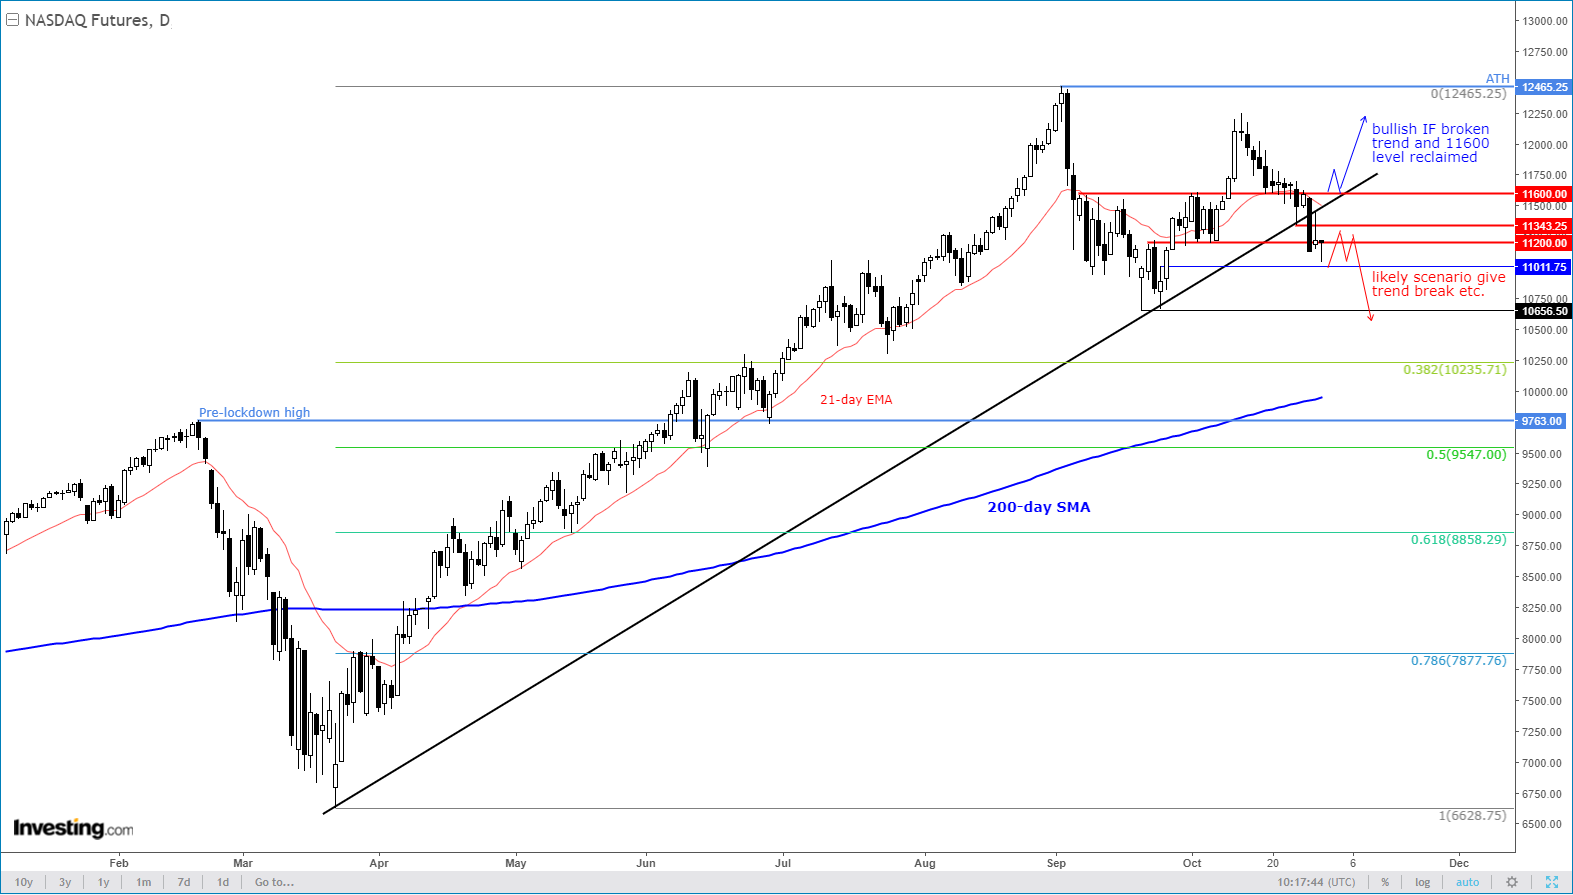
Thus far, the NASDAQ has not formed a lower low to objectively tell us that the trend has turned bearish. So, we need to remain open minded and objective. BUT the fact that the index failed to hold its own above the prior breakout area and support around 11,600—not to mention the breakdown of the rising trend line—means the bulls appear to be the trapped group of market participants, nonetheless.
If this is indeed the case, then logically the market ‘should’ drop to levels where the bulls’ stop loss orders will be resting. One of those areas was below old support around 11,200, which has already been taken. The next big pool of liquidity—and thus a key bearish objective—would be beneath the September low at 10,656ish. To enhance the probability of the index dropping to this level, we now need to see acceptance below that 11,200 level.
However, if there is no acceptance below the 11,200 level, then be mindful of a possible short covering rebound. Even so, the bearish bias would not completely end until and unless we go back above the broken bullish trend line and the prior key support and resistance level of 11,600.
So, those are the two key short-term scenarios to watch for in the coming days as we get closer to the election. Overall, though, investor sentiment remains cagey and the trend bearish for the major indices. Against this backdrop, I would lean more towards looking for bearish than bullish trade setups, until the charts tell us otherwise.
