by Pinchas Cohen
Ask anyone who knows almost nothing about markets and the most likely bit of wisdom they’ll share is that old adage, 'buy low, sell high.'
Yesterday, the S&P 500 Index posted its 47th record high this year. This second-longest bull market for US stocks, in its ninth year now, has a 31.5 Shiller P/E, 87.5 percent higher than the historical mean of 16.8. If you believe the old saw quoted above, buying now would hardly be a prudent move.
Nevertheless, to be honest, this market does have a variety of extenuating circumstances working for it, such as the financial crisis of 2008 which led to the unprecedented degree of QE and near-zero interest rates. none of these things fit the typical market template, rendering moot historical comparisons. Warren Buffet himself, while acknowledging that markets look expensive, maintains that long-term interest rates are so low stocks are actually still attractive.
We’re not going to argue with Warren Buffet. Presumably he remains in the hunt for undervalued assets. Generally that means looking for the biggest losers...that still show promise.
Energy: Opportunity On Losses?
Yesterday’s biggest loser was the Energy sector (Energy Select Sector SPDR (NYSE:XLE)), which actually dropped 0.70 percent, even as all three major US indices made fresh records. Energy is also the biggest loser on a weekly basis, with an 0.85 percent loss—again, while the broader market is repeatedly hitting records.
That’s surely got to be burning traders already in a long position, but it might create an opportunity for a new trade.

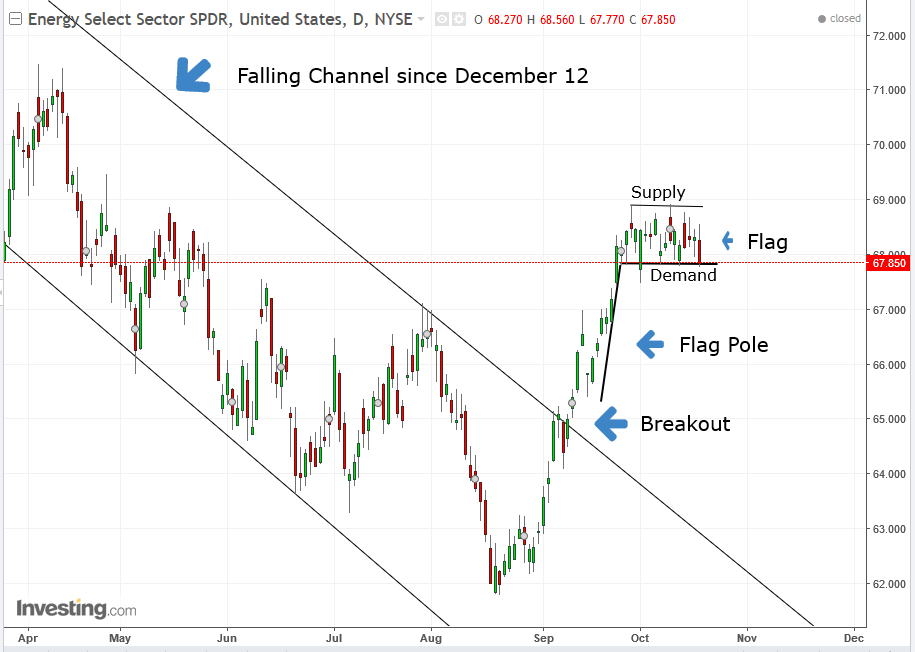
As you can see in the chart of the XLE ETF, above, which tracks energy stocks, the price has reached the bottom of a range, in which it has been trading since late September.
The fact that prices have been confined to this range indicates that the range-top is dominated by supply and the range-bottom is dominated by demand. Otherwise, prices would just randomly walk all over the chart. The range is a pause after the preceding sharp move, beginning on September 15, from the low of 65.40. Traders are taking a breather as they try to figure out whether the preceding move was a fluke or part of a larger trend, with another leg on the way.
The upside breakout on September 12 of the falling channel that had been dominating the sector since December 12 suggests the falling trend is over, which may mean the 11 percent rally since August 18 is only the first leg of a new, rising trend. Having said that, a new rising trend cannot be called before there are a minimum of two peaks and troughs in an upward direction. So far, however, there is only one high of 68.9, registered on September 28, higher than the former July 28 high of 67.125 and zero higher lows.
Still, the range we discussed above, starting in late September, appears to be a continuation pattern, by the name of Flag. The 5.38 percent move in just nine sessions between September 15 and September 28 form the “Flag Pole,” which is used to measure the target price, and the range is the body of the Flag. The pattern is complete with a decisive, upside breakout, signaling the next leg, repeating its predecessor.
Trading Strategies
Conservative traders don’t trade against the main trend. They would wait for a minimum of two peaks and troughs with higher prices, before entering a long position.
Moderate traders would rely on the flag’s pattern, after the upside breakout.
Aggressive traders may go long now, as the price is at the very bottom of the range (even if it doesn’t prove to be a flag, in case of pattern failure, i.e., no upside breakout).
Stop-loss
While it is acceptable to place the stop-loss beneath yesterday’s 67.77 low, the October 2nd, 67.49 low opens up the potential for a retest of that low.
Target
The pole measures $3.5, suggesting the next move will repeat the distance toward 72.5 within the same nine-session time frame.
