In his iconic book, The Intelligent Investor, which has become the definitive text on value investing, Benjamin Graham wrote:
"The market is a voting machine, whereon countless individuals register choices which are partly the product of reason and partly the product of emotion.”
Yet even among the most reasonable there can still be disagreement, though the emotional result may not always be good for market momentum. Yesterday's stock advance was said to be the result of escalating yields starting to ease, allaying concerns of rising inflation. Funnily enough, today’s rally is happening—wait for it—because yields are rising, since accelerating prices would boost economic growth, as company profit increase, creating more jobs.
On The Street, however, such contradictions are often the prelude to a major move, which occurs when one way of thinking wins the argument and the opposition is convinced and both join forces.
The current equity rally is being buoyed by reflation bets, which favor value stocks, those shares that underperformed last year amid lockdowns, while tech stocks were benefiting from the stay-home environment. It’s no surprise then, that now, of the major US benchmarks only the NASDAQ 100 has been moving sideways.

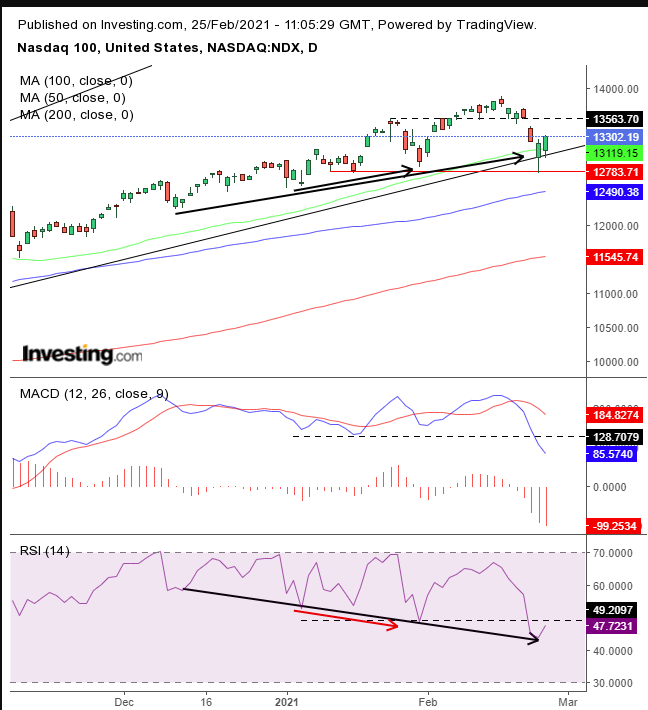
On Tuesday, the tech-heavy index temporarily slipped below its uptrend line since March. The price rebounded after the Fed assured investors that it will not raise rates in an environment in which near-zero rates have stretched the valuations of tech shares to dotcom bubble levels.
Nevertheless, despite Tuesday’s rebound, which trimmed most of that day’s losses by the close, as well as Wednesdays’ continuing slow advance, we may be witnessing the final attempt by the index to push higher, before a correction.
Tuesday’s lows retested the January lows, which, in addition to slipping below the trendline—for the first time since it was readjusted after the index fell below a steeper uptrend line in September—paint a picture of a H&S top, named for the shape that trading assumes amid a gradual reversal, which fits the pattern that would correspond to a market argument.
The left shoulder and head rise along with the prevailing trend supporting the tech index, but the head’s failure to retain its gains illustrates the shift in the balance. If the right shoulder were to form at a point lower than the head, producing a lower peak, followed by a downside breakdown of the neckline—the trend line that connects the range’s lows—forming an even lower peak, it will have completed a reversal. Should this happen, it would manifest that the market is in agreement that tech shares should suffer as investors rotate capital into value sectors as part of the reflation trade.
The MACD’s short MA failed to maintain its dominance over the long MA, as recent prices broke down, suggesting prices will, in fact, top out. The RSI has fallen below its late-January low, showing weakening momentum.
Yesterday, the momentum-based indicator found resistance at the level of the previous low. Finally, that previous low of Jan. 29, was lower than the one before that, on Jan. 6, providing a negative divergence to the price’s rising lows.
In fact, the RSI lows have been in decline since December, against the rising price during the same period, demonstrating a lack of participation. A market that rises because of little selling resistance could fall when this appears.
Trading Strategies
Conservative traders should wait for the right shoulder to form lower than the head, followed by a fall below the neckline, employing a minimum 3-day (preferably to include a weekend) and 3% filter, to avoid a bear trap. Then, they’d wait for the likely return-dip and await confirmation of pattern resistance.
Moderate traders would wait for the downside breakout but be content with a 2-day, 2% penetration, then wait for a short squeeze to push the price to a better entry point, if not for a reversal confirmation.
Aggressive traders could short upon a 1-day, 1% downside breakout, without waiting for any added evidence that the pattern represents an argument won by reflation traders, provided they read this post carefully and understand the risks and are willing to accept them. A coherent trading plan is crucial for successful trading. Here’s just an example:
Trade Sample – Short Position Setup
- Entry: 12,700
- Stop-Loss: 13,000
- Risk: 300 points
- Target: 11,800
- Reward: 900 points
- Risk:Reward Ratio: 1:3
Author's Note: This sample is provided to showcase the components of a basic trade plan. Given that we don’t know the future, we can't know whether “countless individuals (will) register choices” accordingly. In the same vein, we don’t even know whether reason or emotion will prevail. Or even what would constitute the reason. Or the emotion. If it isn’t clear yet, we don’t really know anything. We are merely navigating the tangles based on our interpretation of previous moves relying on our experience. Your budget, timing and temperament will have an impact on your trading success and your style must incorporate that. Till you figure out how to do it, trade in small increments, to learn, not to win big, because otherwise you are sure to lose big. Happy trading!
