Yesterday, a House Financial Services subcommittee hearing gave US lawmakers an opportunity to attack the asset least favored by regulators and institutions: Bitcoin. Representative Brad Sherman, a Democrat from California said that “cryptocurrencies are a crock,” and Rep. Carolyn Malone, the New York Democrat said that investors are “pouring their life savings into virtual currencies and they stand to lose a lot of money when this bubble eventually bursts.”
If that weren't enough, Google banned cryptocurrency related ads, hurting the legitimacy of what crypto enthusiasts were hoping would become the new-age currency.
Bottom line, over the last 24 hours, $60 billion was erased from the overall value of cryptocurrencies. However, Bitcoin fans refused to be deterred and picked up all of today’s oversupply, balancing the price with yesterday’s close.
Where to from here?

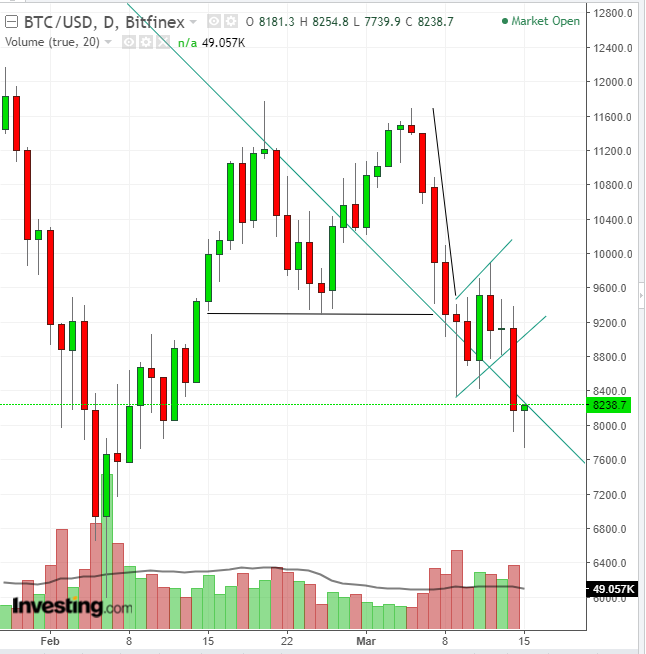
Since the March 4 Hanging Man, we have been discussing a potential double top; yesterday we wrote about the bearish Rising Flag. Both patterns have been completed while free falling below the 200 dma for good measure. Also, the volume on the downside breakout has been the highest since March 9, the final day of the sharp decline – the Flag Pole – preceding the consolidation of the Rising Flag.
This demonstrates participation, lending credence to the breakout’s legitimacy and therefore signals a sustainable decline. At the same time, the price yesterday fell back into the falling channel. While the price bounced today, trimming all losses, forming a potential bullish Hammer, on a close, the price is still within the confines of the channel.
So is Bitcoin's rebound sustainable? Considering the preponderance of technical evidence, the answer in our view is no.
Trading Strategies – Short Position
Conservative traders would wait on a likely return move, to retest the flag’s resistance and the tenacity of this decline, which would be confirmed with at least one red candle engulfing the preceding green candle.
Moderate traders might wait for the return move but not wait for a confirmation, entering a better place for the presumed continued downtrend.
Aggressive traders, who may fear losing the trade, if they waited for a return move that never came, may enter now, providing they can afford a meaningful stop-loss or the capital risk.
Equity Management
Stop-Losses (above provided prices):
- $8,279 – today’s high, demonstrating that supply overcame demand at that price.
- $9,066 – 200 dma, a favorite among traders, who provide a resistance.
Targets (above provided prices):
- $7,000 – double-top’s implied target
- $6,000 – Rising Flag’s implied target.
There are many trading strategies available for the same instrument in the same time. A trader must establish a plan, which would include his resources and temperament. This is crucial and determines success or failure.
Pair entries and exits should provide a minimum 1:3 risk-reward ratio. They should suit your time frame, with the understanding that the further the prices, the longer it will take to achieve them. Finally, understand that these guidelines are probability-based, which means by definition they include losses for individuals, with the aim of profits on overall trades.
