Another major investment firm has predicted the demise of Bitcoin. Allianz Global, part of a German financial services company that manages half a trillion euro, said:
"In our view, its intrinsic value must be zero."
Blockchain technology is beside the point, according to Stefan Hofrichter, Head of Global Economics and Strategy. He wrote that “a Bitcoin is a claim on nobody—in contrast to, for instance, sovereign bonds, equities or paper money—and it does not generate any income stream.”
The classic counter argument is that the same could be said about gold. The difference however is that the yellow metal stood the test of time as a store of value since the beginning of recorded human history. Bitcoin, Hofrichter seems to claim, will never have that standing.
Additionally, he points out that the investor view on Bitcoin "ticks all of the boxes" for a bubble, such as thinking that a "new-era" is upon us, which leads to decision made on emotion rather than analysis. This typically leads to a bubble, and "one that is probably just about to burst."
We would point out that Hofrichter maintains the view that Bitcoin is in a bubble even after the cryptocurrency has more than halved its value since its December 17 all-time high, right under $20,000.
Google Bans Crypto Ads
Meanwhile, Google plans to ban all cryptocurrency related ads.
"We don't have a crystal ball to know where the future is going to go with cryptocurrencies, but we've seen enough consumer harm or potential for consumer harm that it's an area that we want to approach with extreme caution," Scott Spencer, Google's Director of Sustainable Ads told CNBC.
One thing is certain: this isn't good for crypto business or morale.
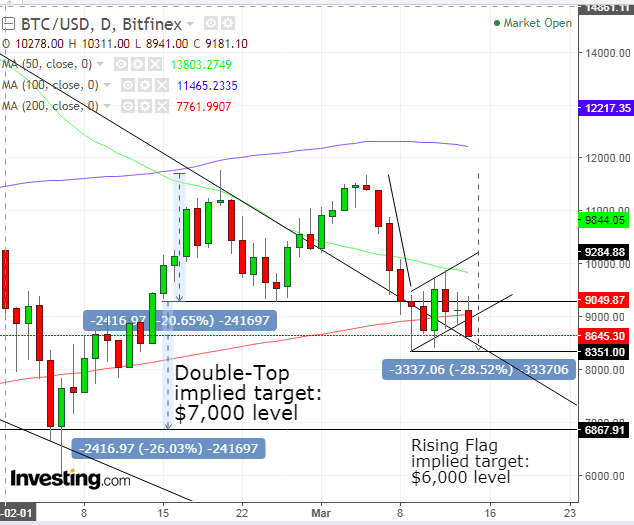
The daily chart is complex, and we will attempt to break it down and simplify it.
Above Falling Channel – Bullish
First, in the beginning of the month, the price broke 12 percent above its falling channel since December, putting the downtrend into question. The price completed a return-move, to retest the channel top. On March 9, the price dipped more than 10 percent, deep back into the channel, but closed near its opening, right on top of the channel, forming a hammer, bullish candle, for good measure. Since then, the hammer's $9,037 support has not been touched.
Double-Top and Rising Flag – Bearish
On the other hand, even after the upside breakout of the falling channel, its March 5, $11,696 peak, failed to overcome the February 20, $11,776 peak, which would have been required to form an uptrend. Furthermore, prices have declined since, falling below the previous, February 25 low of $9,284, completing a small, Double-Top.
However, as discussed above, the neckline penetration coincided with the forming of a bullish hammer, from which point prices always rose, threatening to blow out the double-top bearish implications.
Still, the rise since the hammer's rise was done very tightly, following a sharp, 5-straight-day decline, forming a Rising Flag, a continuation pattern. A downside breakout signals a resumption of the underlying trend, and since it comes from above, the trend is down.
As 7:00 EST, the price of around $8,660 is below the flag, suggesting a downside breakout. However, fakeouts are commonplace, especially for an asset as volatile as Bitcoin. Moreover, the price may find support by the channel top, compounded by the March 9 hammer. A penetration below the $8,351 support will strengthen a case for a short, while a close will make the case stronger yet. Traders employ filters to eliminate a bear trap when the price bounces back to stop out all the shorts, even if it then continues to sink.
Moving Averages – Bearish
Both the 50 dma (green) and 100 dma (red) are pointing out that their averages are falling, and the current price fell below the 200 dma (red) A close would reinforce the fact that prices are falling lower than the multiple gauges reflected by the major MA's and signal that a downward momentum may be gearing.
Target Implications – Short Position
The Double-Top implies a $7,000 target, and the Rising Flag suggests a $6,000 target.
Trading Strategies
Conservative traders would wait for the price to close beneath the hammer's $8,350 support, followed by an upward correction that would test the pattern's resistance, confirming the downtrend's validity.
Moderate traders may be content with a close below the pattern.
Aggressive traders may risk a short immediately, providing they can afford a meaningful stop-loss or capital risk.
Equity Management
Stop-Losses:
1. $9,050, 200 dma (red)
2. $9,400, today's high
3. $9,845, 50 dma (green)
4. $10,000, psychological round number
5. $10,300 - current angle of flag top
Targets:
1. $8,600, channel top
2. $8,351, hammer support
3. $8,429, March 11 low, the only price deviation from the flag, which found support by the hammer.
4. $7,000, double-top implied target
5. $6,000, rising flag implied target and previous trough, February 6 support.
There are many trading strategies available for the same instrument in the same time. A trader must establish a plan, which would include his resources and temperament. This is crucial and determines success or failure.
Pair entries and exits should provide a minimum 1:3 risk-reward ratio. They should suit your time frame, with the understanding that the further the prices, the longer it will take to achieve them. Finally, understand that these guidelines are probability-based, which means by definition they include losses on individual trades, with the aim of profits on overall trades.

