By Pinchas Cohen
Old-World Business Outperforms The New For HP
HP Inc (NYSE:HPQ) is scheduled to report earnings for the fiscal quarter ending July 2017, after market close.
The forecast is for a $0.42 EPS, down 6 cents from $0.48 for the corresponding quarter last year. In the last quarter, the company reported a 2.6 percent earnings beat.
In 2015 Hewlett-Packard broke its 75-year-old business in two: Hewlett Packard Enterprise Co (NYSE:HPE) would sell software products and service, while HP Inc (NYSE: HPQ) would sell printers and computers.
Microsoft (NASDAQ:MSFT), Amazon (NASDAQ:AMZN) and Apple (NASDAQ:AAPL) are notable examples of companies that have been shifting their businesses from hardware to software and service. These companies have been able to not only survive in this tough market, but thrive – by adapting to an environment where the rate of technology advances exponentially.
In stark contrast to these tech companies, HPE (software and services) has lost 23 percent this year, while HP (hardware) has gained 28 percent. The old-world business has outperformed the new world business by 53 percent.
Without getting into the fundamentals of each, today’s market is driven by investors’ concerns of Trump’s unpredictability as seen in the last two weeks, with North Korea, the violence in Charlottesville, his renewed threats of abolishing NAFTA, and his threat to shut down the government if he doesn't receive funding for a wall on the border with Mexico.
This market dynamic is expressed in pressure on global stocks as well as US futures, which are expected to resume with US equities. The US equities should resume the S&P 500 Index futures' decline.

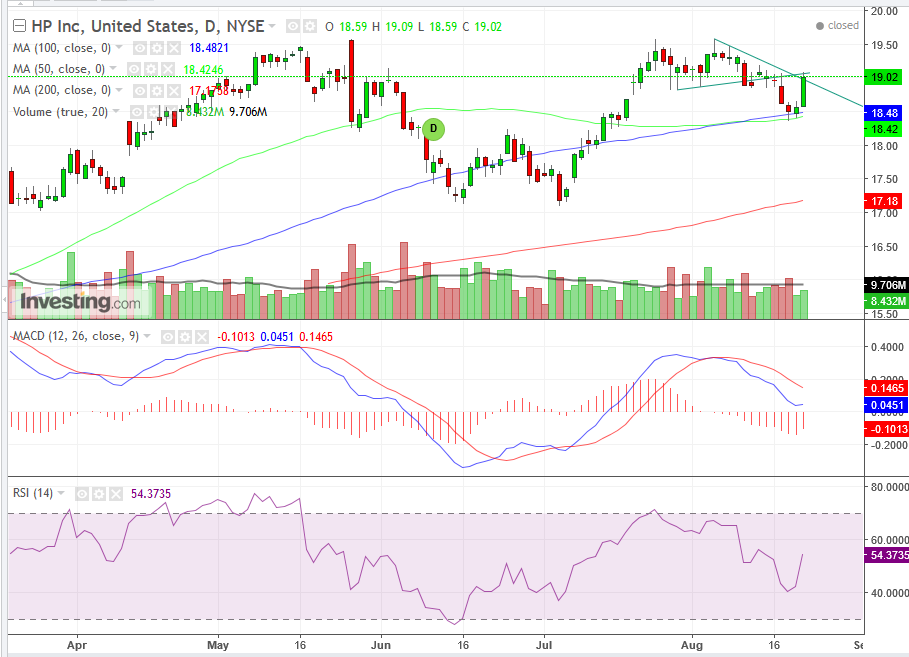
HP, which completed a small double top last Thursday, saw its biggest one-day climb yesterday since May 30. However, the price was stopped short at the intersection between the double-top neckline and the downtrend line since August 4. This advance constituted the classic return move of a breakout, and the fact that price got stuck at the double resistance confirms its significance. Today’s risk-off sentiment will find new willing sellers to join the pre-exiting ones who stopped the climb at $19.
Note that volume has diminished with the return move, while it has spiked in the pattern completion of the crossing below the neckline. This is not necessarily reflective of HP but of the stock market in general as geopolitical uncertainty looms as well as the much-discussed central bankers’ meeting at Jackson Hole, Wyoming. This is the same impetus that is expected to send the stock back, when known market fundamentals agree with technicals.
Both momentum and price averages confirm a recent decline, expressed via the RSI and MACD indicators.
Both the 50 (green) and 100 (blue) DMAs provided support for the return move. Their colliding suggests a catalyst.

Should the small double-top realize the price’s fall, a much larger double-top would be in the making.
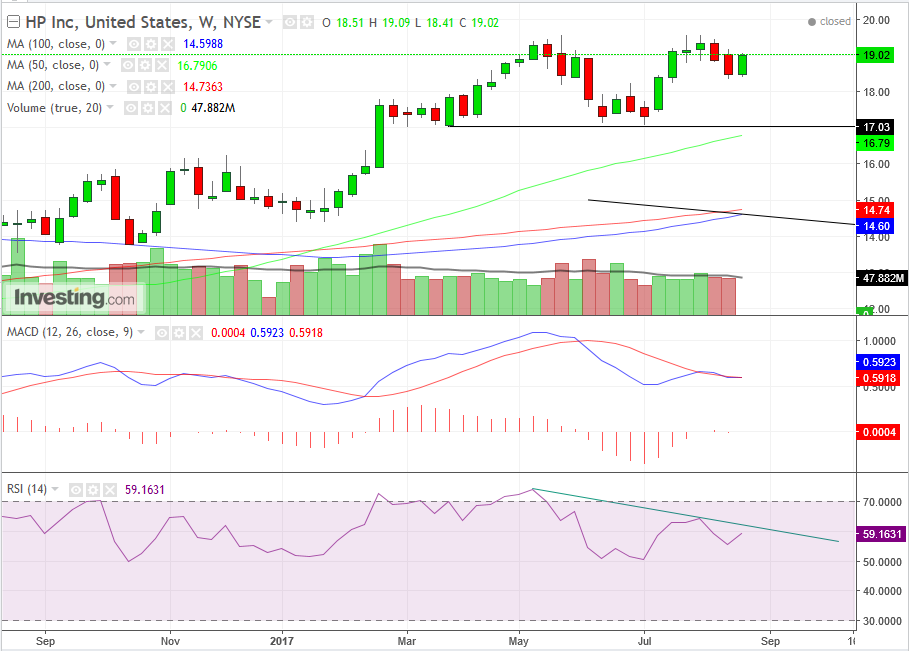
The smaller double top, whose prices peaked at $19.58 exactly both on July 25 and August 4, is the same exact peak level of May 25. For the price to provide a resistance to the very cent three times dispels any argument against the tenets and rationale of technical analysis. The May and August peaks form a large double-top, already five months in the making. The pattern is complete when the price will cross below its neckline, the line connecting the lows of the troughs at $17.00, providing a target price proportionate to the size of the pattern – $2.50, to $15.50.
On the weekly chart, you get the same diminishing volume confirmation as in the smaller, daily double top. First, the volume of the first peak was lower than the volume preceding the peak. Second, the volume of the second peak was even lower.
In a rare occurrence, the weekly RSI and MACD both provide sell signals that agree with those of the daily chart.
Trading Strategies
Conservative traders may stay out of this one. While the pattern completed with a downward cross of the neckline, it’s a small pattern, while the classic, larger pattern is incomplete, providing room for fluctuation.
Moderate traders may short the stock with a very close stop-loss – risking little – above yesterday’s $19.09 high.
Aggressive traders may short, and if they want to ride to the neckline of the larger pattern – possibly to its target price – a stop-loss above the $19.60 peaks would be in order.
Price Targets
- $18.42 – the 50 and 100 DMAs.
- $17.14 – the highest (and therefore closest price traders may remember) of the price rebound on June 16
- Should the larger double-top complete: $16,.20 – which is the November and December support
- $15.50 – which is the minimum target price
