On Wednesday, December 27 we published an in-depth fundamental and technical analysis for oil with a forecast and target. Today, on the 6th session since, the $62 target has been reached, with a high of $62.20.
Why Very Aggressive Traders May Short
Now may be a good time to allow for a high-potential correction before entering another long position. Very aggressive traders may short such an expected correction for the following reasons:
- The price just appreciated almost 11 percent, ripening for a correction.
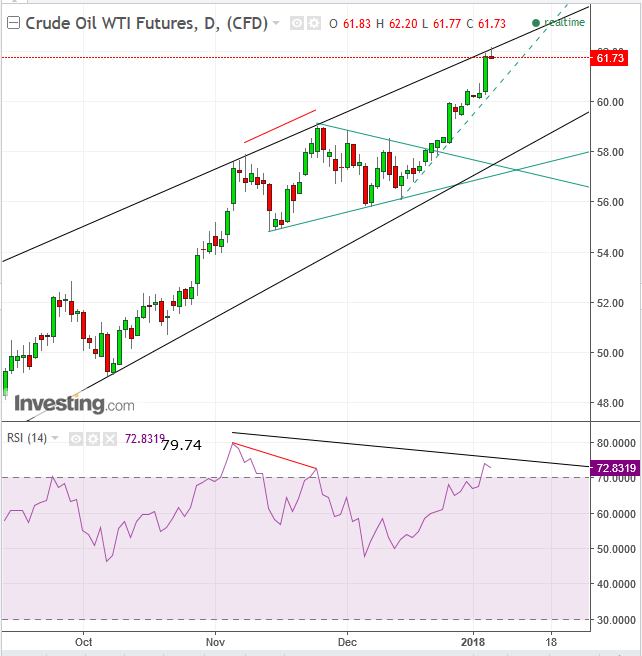
- It is forming an intra-day bearish shooting star. Locked on closing, it demonstrates that sell orders outweigh buy orders at these levels.
- The shooting star is forming after the price penetrated the channel-top where sellers have been overcoming buyers, compounding its significance.
- The RSI is oversold at nearly 74.
- The RSI formed a negative divergence as it registered lower than its November 79.74 read, against the price rally in the same period. A declining momentum demonstrates that the rate of the price rally has slowed down, potentially increasing a reversal, should demand continue to dry up. Note that an earlier negative divergence developed (marked with a red line) when momentum dropped, while price rose from November to December. Although the price did in fact continue to rise, a negative divergence may lead to a decline at a later stage than its development. The current divergence, marked with the black line, may be shown when the earlier warning would be vindicated.
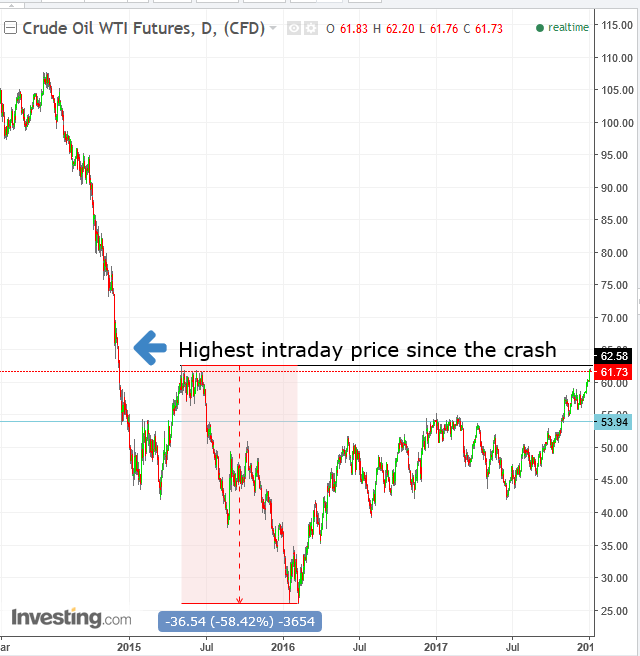
- While yesterday’s closing price of $61.84 overcame the highest close following the 2014 crash which was registered on June 2015 at $61.43, yesterday’s highest intraday price of $62.20 failed to climb above the highest price on an intraday basis since the crash which was posted on May 6, 2015 at $62.58. If we noticed it, so did others. They may also remember the 58 percent plunge in the following 8 months and are likely to increase sell orders, weighing the price down.

Trading Strategies – Long Position $70 Target (Very Aggressive Short To $59)
Conservative traders would wait for a correction to the bottom of the channel, probably at around $58.40, and wait for a resumption of the uptrend, signaled by registering a higher intraday price than the May 6, 2015 level of $62.58.
Moderate traders might be content with a correction to the channel bottom and confirm its integrity with a bounce, whose close will cover the preceding daily decline.
Aggressive traders may enter a long position up on a return to the $59.00 level, and the expected support the triangle’s highest price would provide.
Very aggressive traders may enter a short position, upon a close with a bearish shooting star, with a stop-loss above the shooting star’s high price, with a $59 target. Or alternatively, they may keep the position open just trailing the stop-loss, in case of a fuller correction or even downside breakout of the channel on the 2.5 year peak resistance, when US shale might kick into a higher gear, driving down prices again.

