How to Trade Financials - the Only Sector in Green
Investors were riled Tuesday when the 10-year U.S. Treasury yield surged above 2.550, to its highest level since mid-March. It followed the BoJ’s unexpected decision to stop buying long-dated bonds.
That Treasury selloff led to Janus Henderson Group’s billionaire bond portfolio manager Bill Gross's announcement that bonds have entered a bear market. In a bear market, rallies are considered corrections, providing a shorting opportunity ahead of deeper declines within the main trend.
Finally, a report yesterday that China is considering slowing its purchasing of Treasuries provoked already nervous investors, pushing yields toward the 2.6 percent mark, just 1.5 percent below the December 2016 peak since the July 2016, near 1.3 percent bottom. This morning however, China issued a warning that yesterday’s report may have been fake.
While this provoked a selloff in the Real Estate Select Sector SPDR (NYSE:XLRE) and Utilities (NYSE:XLU) sectors (whose high dividends renders them bond proxies when Treasury yields disappoint), dragging down stock averages, it simultaneously boosted the Financial sector (NYSE:XLF). Banks are expected to profit when interest rates rise, widening the gap between their yields on assets and what they pay for funds. Sure enough, Financials was the only sector in the green, rising 0.83 percent, holding up the S&P 500 Index from a deeper plunge.

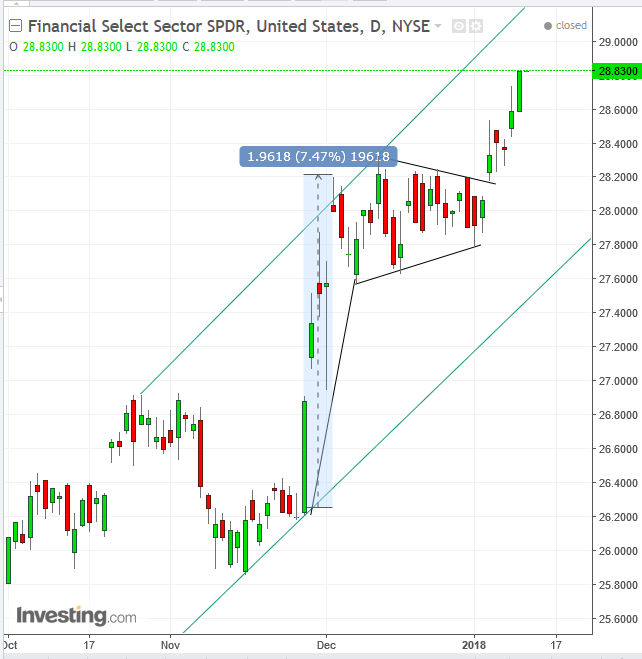
The ETF has been trading within a rising channel since September 7, whose lower bound is made up of buyers and upper bound is plotted by sellers, but the rising trajectory demonstrates that the selling is profit taking and the lower bound is the ongoing trending demand.
On November 28, the price leaped from a low of 26.10 to a December 4 high of 28.20, $1.96, or 7.47 percent, in five trading days. Such a quick profitable move is followed by profit taking of the prior move and soul searching for the following move. The upside breakout on January 4 signaled the end of the range and a resumption to the uptrend, prior to the interruption. The preceding move is called a flag-pole and the range is named pennant.
Target: $30
The implied follow-up move is measured against the preceding move. The same psychology is expected to repeat. While the implication was for a bit higher, the psychological round-number may hinder an advance.
Trading Strategies – Long Position
Conservative traders would wait for a return-move, which would confirm the pattern with a bounce, whose daily upside would cover the preceding daily downside.
Moderate traders would wait for a return move, but would not necessarily wait for a confirmation of the integrity, with a bounce, but rather enjoy the low risk of a close entry to the pattern support.
Aggressive traders may enter now, providing they can afford a stop-loss below the 28.20 pennant top or accept the risk of a potential return move, which would stop them out with a higher stop-loss. A happy middle-of-the-road option is to wait for a partial return move, or close enough, so that they can afford a proper stop-loss.
