By Pinchas Cohen
Last Thursday, we posted the first article in a series to be published over the next few days taking a closer look S&P 500 sectors. Last week's article offered a deeper drilldown into the energy sector and oil. Yesterday, we provided analysis and trading strategies for the S&P 500 Index financial sector via the Financial Select Sector SPDR (NYSE:XLF) in the midterm.
Today, we'll show how that fits into the larger picture and describe how to possibly make some of the money the banking segment may be about to lose.
Trading The Financial Sector: Mid-Term
Stocks surged yesterday on a return to risk appetite as we predicted, after North Korea didn't launch another intercontinental ballistic missile over the weekend and Irma wreaked less havoc in the U.S. than expected.
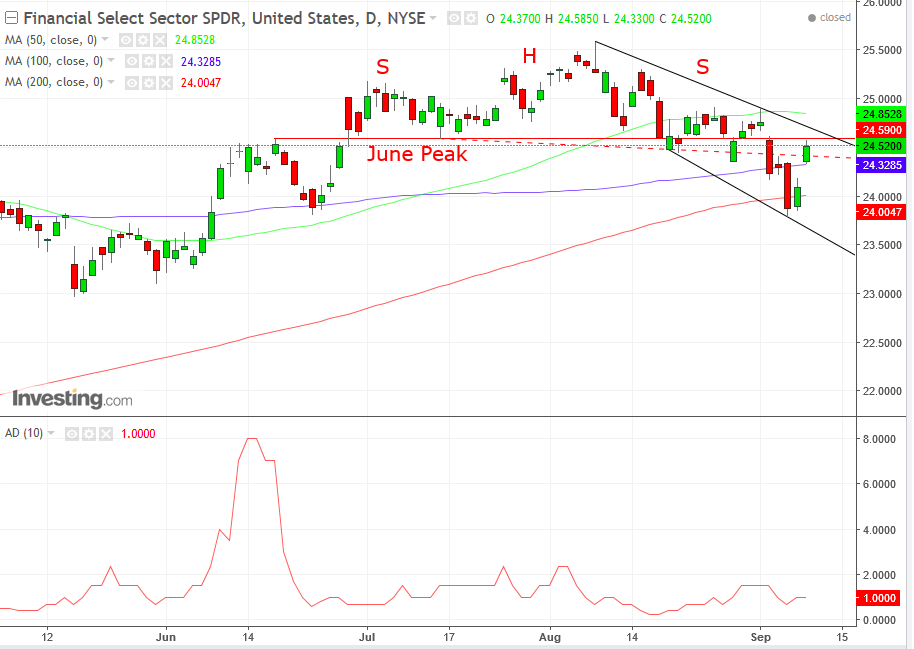
The sector’s bounce only hastens the ball to the bat for an even harder hit; price returned to the level of the June peak – a level which provided resistance through July and August. This resistance was confirmed when it was touched and price promptly declined, as if red-hot. The price returned to the top of the falling channel since the head of the H&S in August.
It is currently smack on the neckline (dotted red). Note that the support line, the bottom of the falling channel, which was dotted in yesterday’s post, turned solid after it was rendered a low with yesterday’s advance.

Note that the support line of the falling channel just happens to be where the 200 dma (red) was, which bounced the price to above the 100 dma (blue). Technically, these price benchmarks cause friction that prevents a freefall. The last time the 200 dma was penetrated was June 14, 2016, when the price plunged almost 7 percent in 2 weeks, but only after a nasty 4-percent whipsaw at the interim.
So, hold on (using the appropriate stop-losses, as described in the previous post). It could be a bumpy ride.

Finally, as discussed here, the benchmark has been displaying a lack of participation with other stocks, which is a telltale sign of a potential top. The same can be seen with the financial sector, as each peak within the developing H&S top is lower than its predecessor.
Trading The Financial Sector: Long-Term
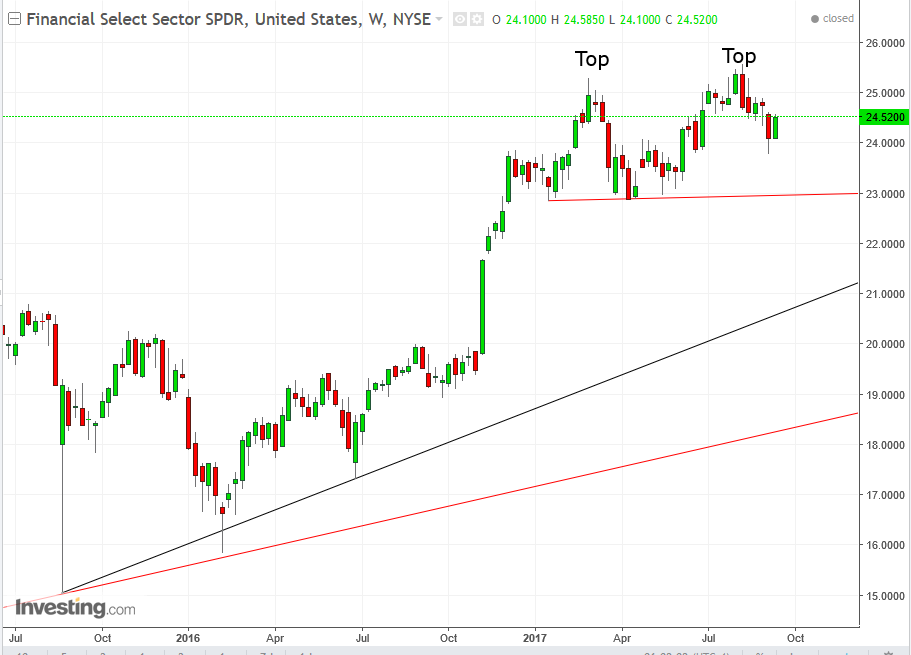
Should the H&S top fulfill its implied target price of $23.60, the sub-index would be set on a collision course with the neckline (the line that plots the troughs) of a massive double-top throughout all of 2017. Although the end of July and beginning of August registered a higher peak than the former, end-of-February peak, the financial sector displayed inherent weakness in that it failed to rally to another meaningful peak.
To be sure, the trend is still up, but a double-top will be called before a decisive break of its $23.00 neckline. Should such a break occur, the target implication would be a 10 percent move down to $20.70.
However, it may find support by the rising trendline since August 24, 2015 (black). After it successfully crosses below it, the price will then contend with the primary uptrend line since March 2009, the bottom of the worst crash in our lifetime. A break of that uptrend line would suggest an end to this bull market.
Since trends, peaks-and-troughs and price average analysis tend to develop into a cohesive structure, we’re wagering that – should the double-top neckline break and the target price be achieved – it would occur around March of next year, as that is when the primary trendline will reach the $20.70 level.
Trading Strategies
Conservative traders would wait on a short for a decisive cross below the double-top neckline, which is also the uptrend line since August 24, 2015, placing a stop-loss above the neckline, to accommodate a return-move. Be sure to allow a take-profit of at least 3 times the risk. For example, if the entry is at $22.00 and the stop-loss above $23.00, allowing a $1.00 risk, the potential reward would be no less than a $3.00 decline to the price of $19.00. However, since that would most likely be deeply below the primary uptrend, and therefore may not reach there any time soon—if at all—conservative traders would wait for a better entry, on a rally.
Moderate traders would wait on a short for at least a decisive close beneath the double-top neckline, placing a stop loss above the uptrend line, if not above the neckline. Moderate traders may rely on the distance from the neckline for a reduced chance of a full return move all the way back to the neckline. The distance may also suggest that the return move was already completed. Be sure to allow a take-profit of at least 3 times the risk. For example, if the entry is at $22.30, a stop-loss above $23.00 provides a $0.70 risk. Accordingly, you should not exit the trade before you reap a $2.10 reward at $20.20. Of course, you can close the position, reduce it (or even hedge it with an opposite trade) once you reach the primary uptrend line.
Aggressive traders may rely on the midterm H&S top to enter a short now, with a stop-loss above the $24.59, June peak, or as high as the $24.92, August 25, shooting-star high. A stop-loss above $24.60 would provide an $0.08 risk from yesterday’s close. That means that a take-profit at 23.80 would provide an 8:68, or a 1:8.5 risk-reward ratio. It also means that a $0.24 decline would satisfy the 1:3 risk-reward ratio. A stop-loss above the $24.92 shooting star on August 25 would mean a $0.40 risk, requiring a $1.20 move to $23.30, to satisfy the favorable 1:3 risk-reward ratio. This may take a while, as we expect support at 23.80, the June 23 trough, which was confirmed last Thursday.
Amateur traders will scan through this article, get excited and jump in, looking for a quick profit. We wish them luck, because that’s all they can rely on.
