This article has been written exclusively for Investing.com
Natural gas prices have fallen for the third consecutive day to relinquish almost all this week's gains. NG has lagged other commodities post-lockdown and remains near historic lows because of concerns over excessive supply and weak demand, as renewed lockdowns to contain the spread of coronavirus is expected to limit gas consumption. That said, the weather is seen getting hotter for most of the US over the next couple of weeks and this should mean increased demand for cooling.
Additionally, most of the bearish factors weighing on natural gas ‘should’ now be priced in, which means the downside is limited going forward. Indeed, given that prices are near zero at $1.754 per million British thermal units, there is only so much further they could fall. But one of the key risks facing traders looking to buy NG is that prices could remain low for a long period of time. So, speculators must proceed with caution, remain nimble and take it from one level to the next when it comes to trading NG in this current market environment.
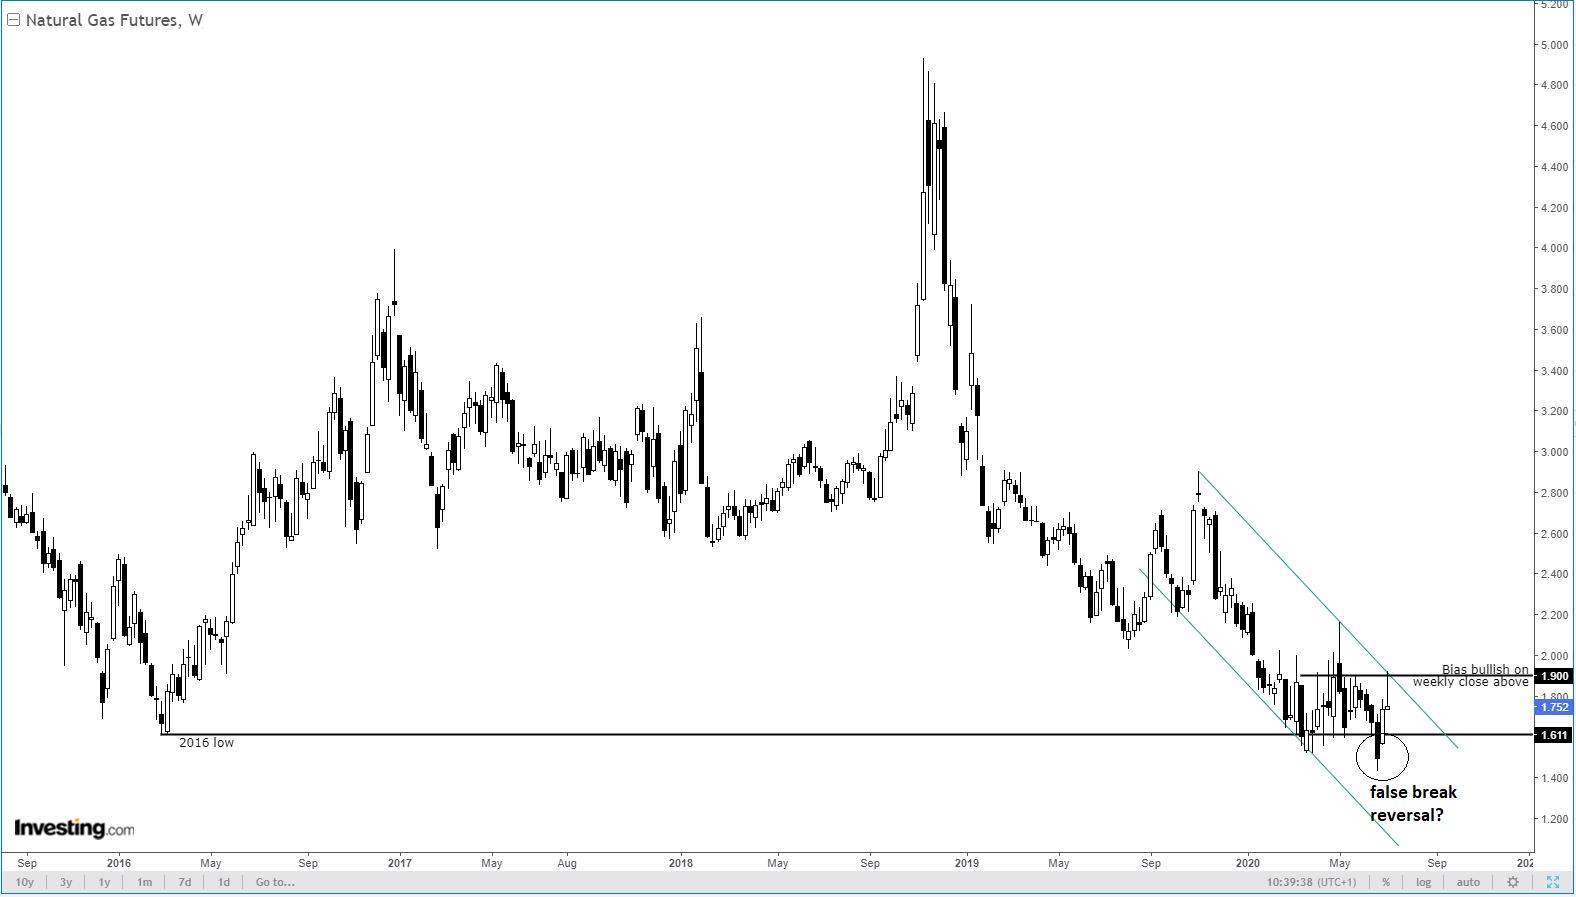
From a technical point of view, natural gas has created some tentative bullish signals, which suggest a low may have already been formed at the end of June. But as the downward trend is still intact, we need to see some further confirmation before concluding that prices have indeed bottomed. Take a look at the weekly chart:

While the bearish channel remains intact, the key price development I would like to draw your attention to is the potential false break reversal that took place at the end of June, when the sellers once again failed to sustain the breakdown below the 2016 low of $1.611 like the previous several times. Since that fake-out happened, NG prices rallied sharply at the start of July before easing back down over the past few days. With prices breaking above a few short-term highs, the trend may have already reversed. But we still need some confirmation. On the weekly, a close above the bearish channel around $1.900 is what I am looking for.
Testing Support
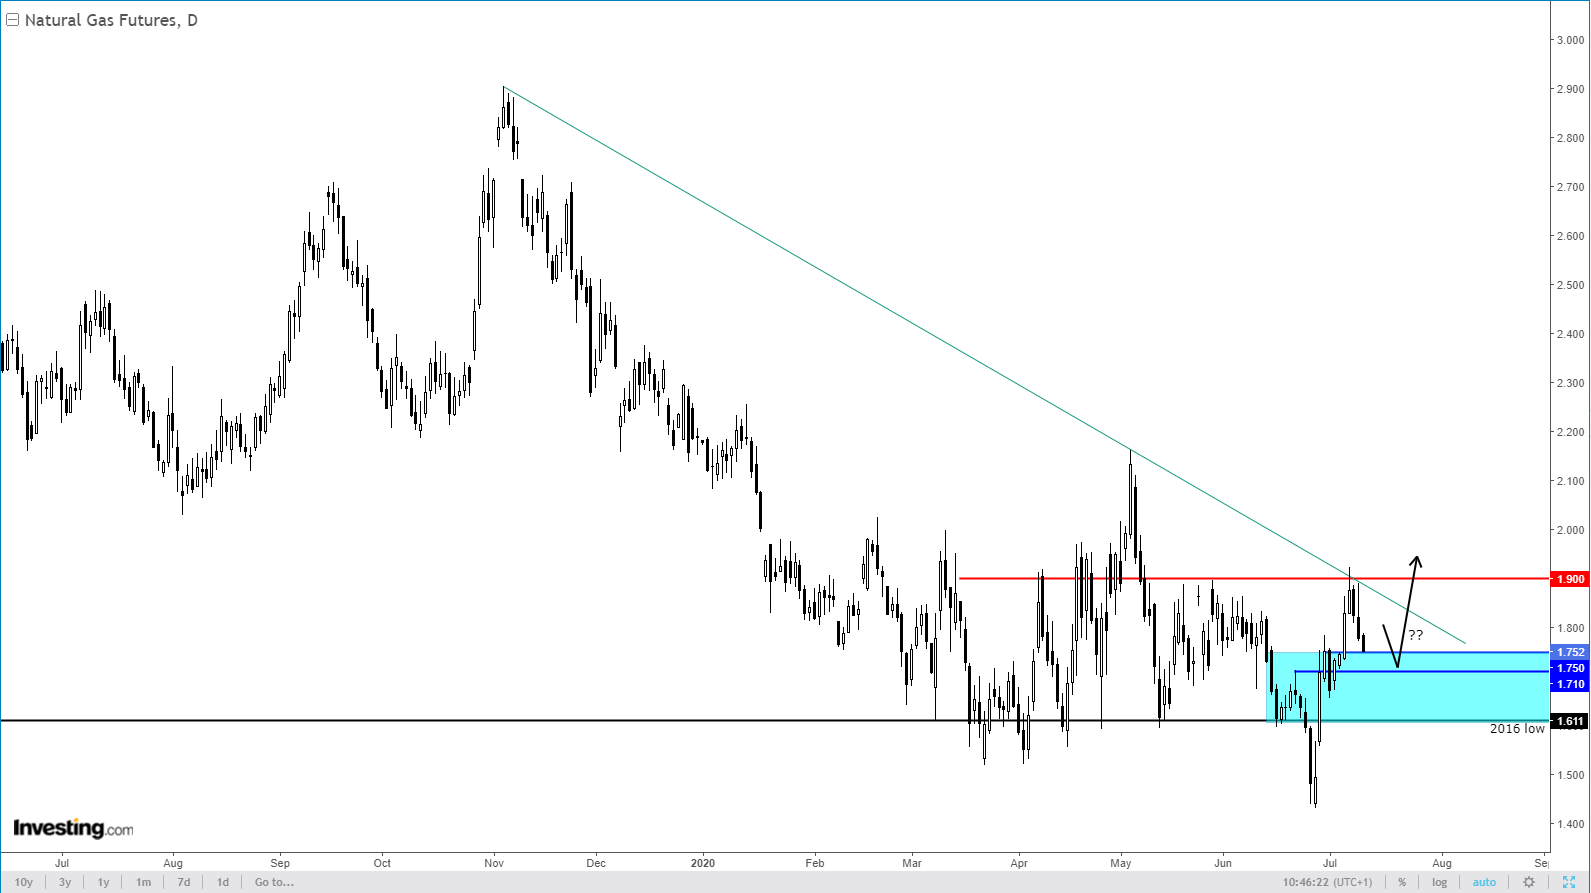
Now on the daily time frame, we can see that NG was testing a potential support zone between $1.710 and $1.750, an area which was formerly resistance:

While there were no signs of a bounce from the above support zone when this report was written, given the weekly technical developments, I would not be surprised if prices turned higher from around here, either later on today, or early next week.
So, in a nutshell, with gas prices being near historic lows and taking into account the above tentative bullish signs, I am now on the lookout for further bullish price action to confirm a low is made. As mentioned, this could be in the form of a breakout above the bearish channel on the weekly, or resistance circa $1.900 which is also quite visible on the daily time frame as well.
But at what stage do I admit I am reading this wrong? Well, I think for as long as we remain above that 2016 low of $1.611, the bullish case will remain valid. However, a daily close back below this level would probably invalidate the short-term bullish price structure. In this event, bullish speculators will need to wait for further price action before looking for long entries again.
