The natural gas bulls can already feel the warm July sun on their faces.
After last week’s inventory data showed a build that was in line with the 5-year average in natural gas injections into US storage, this week onwards could herald the start of more supportive weekly balances in gas, analysts say.
“A string of below-average storage builds are expected in coming weeks,” Houston-based gas risk consultancy Gelber & Associates said in an email to clients on Wednesday, seen by Investing.com.

Overall, the change in weather has prompted Gelber to lower its forecast for storage injections by nearly 50 billion cubic feet from a week ago. The consultancy said it expected consistently stronger demand for air-conditioning that would contribute to higher power burns.
“July heat will be a driving factor providing support to the market."
Smaller Weekly Injection Into Storage Seen
Gelber’s outlook comes as the average forecast from analysts tracked by Investing.com showed that US utilities likely injected a smaller-than-usual 58 bcf of natural gas into storage for the latest week to July 3, as an increase in demand to power air conditioning offset declines in other sectors stemming from the resurgence in cases of COVID-19.
Aside from weaker power burns in earlier weeks, the market has also suffered from a raft of cancellations in shipments of liquefied natural gas, or LNG, that has contributed to a hefty overhang of unused fuel.
Last week’s smaller storage build compares with an increase of 83 bcf during the same week a year ago and a five-year (2015-2019) average increase of 68 bcf for this period.
The forecast 58 bcf is also smaller than the 65 bcf that went into storage during the prior week to June 26.
If the estimates are on target, the increase during the week ended July 3 would still boost stockpiles to 3.135 trillion cubic feet—still 17% higher than the five-year average and about 28% above the same week a year ago.
The US Energy Information Administration will release its weekly storage report at 10:30 a.m. EDT (1430 GMT) on Thursday.
Separately, the EIA projected both gas production and demand will drop in 2020 and 2021, from record highs in 2019, as efforts to slow the spread of coronavirus cut into economic activity and energy prices.
Weather Mostly Supportive For Gas Demand
Data, meanwhile, showed the weather was warmer than normal last week, with 89 cooling degree days, compared with a 30-year average of 80 CDDs for this period.
CDDs, which are used to estimate demand to cool homes and businesses, measure the number of degrees a day's average temperature is above 65 degrees Fahrenheit (18 degrees Celsius).
“The constant so far is a strong heat wave hitting major portions of the US,” said Dominick Chirichella, director of risk and trading at the Energy Management Institute in New York.
“On the premise that the heat wave does evolve as currently forecast the weekly inventory injections will slow and come in below the historical data for the same periods."
The two sets of temperature forecasts for the 6-10 day and 11-15 day periods both show warmer-than-usual trends, Chirichella noted.
“Below normal temperatures are likely to move into the Northwest in the first part of the 6-10 and then gradually shift over into the north-central US."
“Most of the remainder of the West and Plains are forecast to continue in above to much above normal temperatures, except for the West Coast, which may stay near or a little below normal.”
In the 11-15 day period, weather models paint most of the nation in above normal temperatures, said Chirichella.
“Much above normal temperatures are possible for a few days once again in the Midwest and Northeast,” he added.
After 2-Month Highs, Prices Head For 2nd Week Of Gains
What does all this mean for gas prices though?
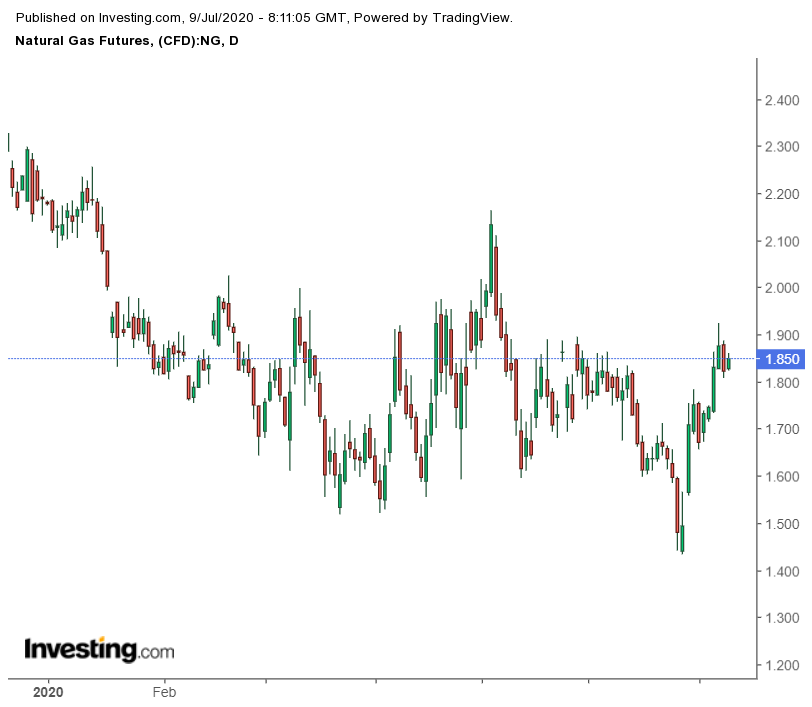
Warm weather forecasts helped front-month Henry Hub gas futures hit two-month highs of $1.923 per million metric British thermal units earlier this week.
If the upward momentum continues, the market could finish the week with a gain of at least 6.5%, marking a second straight week of gains after the previous week’s 16% rally that came from four weeks of nerve-wracking losses.
Disclaimer: Barani Krishnan does not own or hold a position in the commodities or securities he writes about.
