In mid-November, we posted a bearish call on Zoom Video Communications (NASDAQ:ZM). At that time, shares were trading at $403.58.
By Jan. 12, the stock had dropped as low as $333.01. Today, however, we're reversing our call.
We believe shares of the San Jose, California-based video communications platform are on track to resume their uptrend and could retest the stock's Oct. 19, $588.84 all-time high.
Zoom ticked up on Friday after financial advisory firm Bernstein named Zoom its best stock for 2021. The advisory maintains that the 35% selloff since mid-October was exaggerated. Bernstein's expectation for the stock is that it will outperform. They set a price target for it at $610.

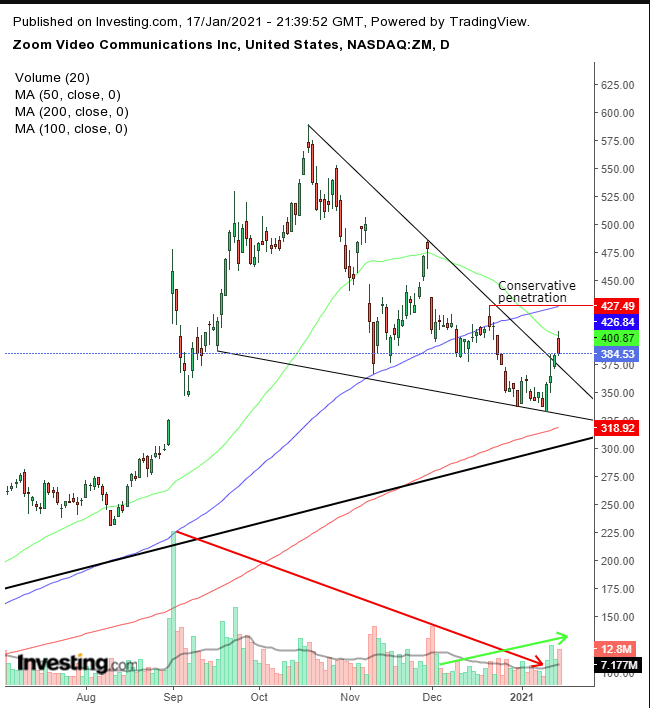
The stock completed a falling wedge, bullish after its 150% surge from the Aug. 11 low to the Oct. 19 record high.
Notice how the pattern completed as its apex met with the long-term uptrend line from January 2020. Also, note that volume was falling while the wedge was developing, demonstrating that the selling didn’t represent the trend. The breakout caused the volume to spike, indicating in which direction momentum was actually in force.
The 200 DMA, which climbed above the uptrend line, supported the wedge, while on Friday the 50 DMA provided resistance. The 100 DMA shows where the technical pressure was—midrange of the pattern, having provided support in November, which turned to resistance in December, indicating where to draw the bottom of the pattern and its technical significance.
Then, the 100 DMA proceeded to meet up precisely with the previous high of $427.47, registered on Dec. 21.
The RSI just peaked above its resistance, signaling a breakout. The MACD already provided a buy signal, when the short MA crossed over the long MA, demonstrating that recent prices are more powerful than those hit previously.
Trading Strategies – Long Position Setup
Conservative traders should wait for the upside breakout to penetrate the Dec. 21, $427.49 high, then execute a return-move to verify the pattern’s integrity, as proof that the rise indeed represents sufficient demand for a resumption of the uptrend.
Moderate traders would be content with a pullback, preferably after a close above the 50 DMA, to minimize exposure.
Aggressive traders could go long now, provided they understand and accept the higher risk that comes with early entry and no confirmation. The higher the risk the more disciplined traders must be.
Here’s an example:
Trade Sample
- Entry: $375
- Stop-Loss: $350
- Risk: $25
- Target: $575
- Reward: $200
- Risk:Reward Ratio: 1:8
Author's Note: The above is just a trade sample. It's not the analysis. Nor is it a prophecy.
It's the likely trajectory of the price if it follows historic paradigms. Nothing more.
The failure rate for falling wedges is 6%, according to Charles Kirkpatrick. Even if the analysis is correct and does play out, the trade sample may still not work out. The odds of its success vary according to your timing, budget and temperament. Create a plan that suits you. If you don’t know how to do that, learn by experimenting with small sums.
