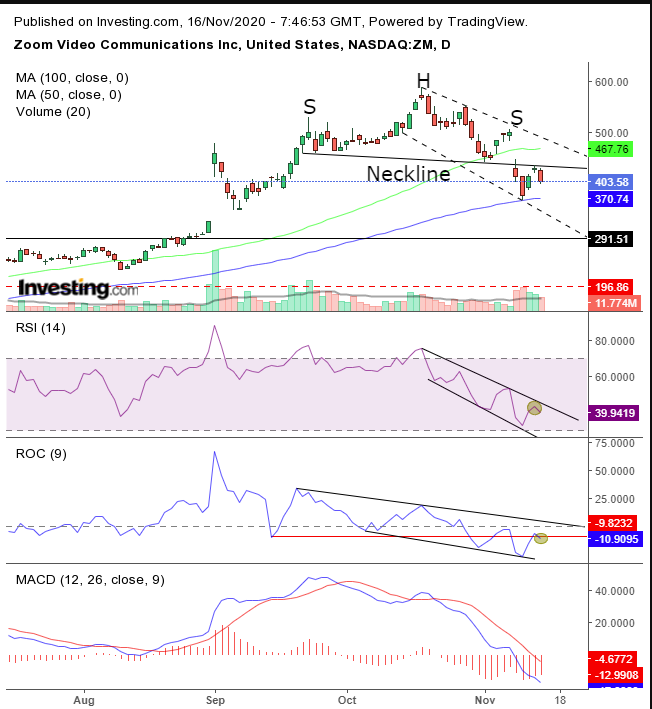
The stock that perhaps most represents the COVID-induced stay-at-home environment, Zoom Video Communications (NASDAQ:ZM), took a dive on Friday, closing down 5.8% for the day, losing 19.3% for the week. Communications – the stock that most represents a stay-at-home environment and which catapulted nearly 600% since the pandemic – dropped Friday 5.8%, or 19.3% for the week – plunging the stock of the company that was at the right place in the right time into the very depths of a bear market, having shed 29% of value since the Oct 19 record close- in favor of industries that were sensitive to the economic cycles.

Zoom completed an H&S top with a falling gap for the downside breakout– a price area where everyone just wants to sell, and no one wants to buy. While an H&S top happens when an uptrend reverses, the gap shows how deep the panic is. Notice, that the price retested Thursday the neckline – where the lows of the top meet – and found resistance, showing plenty of more supply at these levels, pushing the prices lower on Friday.
The RSI curved down having neared the top of its falling channel. The ROC – another momentum-based indicator – found resistance by its Sep 15 low, before the top’s development – and the MACD has been falling hard, with no sign of slowing down.
Meanwhile, the price cut through the 50 DMA, with the pattern’s downside breakout - backed up by the highest volume since Sep 23 when the pattern began developing - till it found support on the 100 DMA. The neckline’s proven resistance is expected to give the power to overtake the 100 DMA, and then bears will aim at the 200 DMA. And this is the interesting part.
Notice how the 200 DMA is aligning with the same price area of the June-Aug congestion, which means there is a lot of interest in those price levels, potentially creating a support on the way down. Finally, measuring the H&S top of about $150 provides the projected target from the point of breakout, which brings the price right to the same price levels.
Technical tip: Traders may recognize what they believe as an Evening Star – a three-candle bearish pattern – Wed through Fri, but it would be a meaningful signal only if it followed a rally.
Trading Strategies – Short-Term Setup
Conservative traders would wait on a short for the price to return toward the top of its falling channel, something it could always do, increasing exposure.
Moderate traders may be content with the price nearing the neckline, for an entry closer to its presumed resistance.
Aggressive traders may short at will – provided they have a plan in place. Here’s an example:
Trade Sample
Entry: $405
SL: $430
Risk: $25
Target (NYSE:TGT): $305
Reward: $100
RRR: 1:4
Note: This sample is just an example of a viable trade, based on our interpretation. However, trading doesn’t exist in a vacuum. Your budget, timing and temperament play a key role in your trading success. Find the risk aversion and patience for the potential reward, relative to your capital and trade accordingly. If you don’t know how to do that, practice with small amounts with no expectations other than learning. If that doesn’t appeal to you, don’t bother. You can NOT become rich fast, and anyone who tells you otherwise is hustling you. Good trading!
