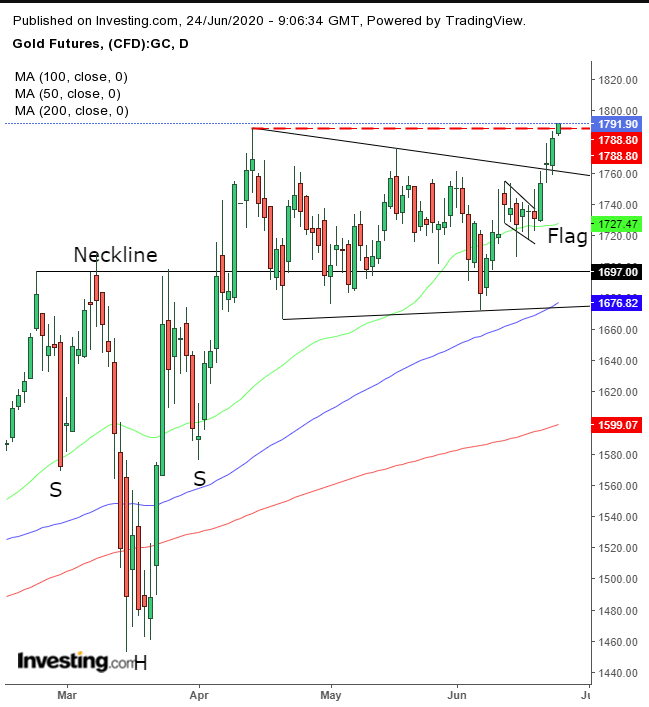
Gold is all the rage, having settled Tuesday at its highest since Oct. 4 2012, going on an 8-year high. We have been bullish gold since early April and, while we remain bullish, we are issuing a second warning about a possible pullback.
Our first warning came on May 18, when the price was at $1,771.85 and had been rallying for five days straight. That same day, it fell to a low of $1,671.70. And, by June 5, gold had lost $100, or 5.6% in 15 sessions.
That's not to say that just because we were right then, we’ll be right now. We’ve had our share of predictions that didn’t go our way. Nevertheless, we’ll make our case as to why traders shouldn’t necessarily jump in after this move higher, on the assumption that gold will just keep going straight up.

Gold completed a H&S continuation pattern in early April, extending the penetration to April 14. Subsequently, the price fell sharply, dropping $1.85 below the neckline, as we’ve drawn it, but only on an intraday basis. The penetration on a closing basis was more modest, at 0.6%, but still too close for comfort. Gold made repeated, deep tests of the neckline, shaking out long positions without wide stop-losses.
This bull-bear struggle continued throughout the range. The first clue that positive change might be underway, where buyers may have been outgunning sellers, was the falling flag, which we began monitoring and reporting on from June 15.
Tired bulls were behind the formation of the falling flag. And, after two months of whipsawing in the daily "coronavirus-market" roller coaster, who could blame them? They just wanted to lock in profits after the 4% jump that preceded the flag, from the bottom of June 5 to the top of June 11.
That gave an opportunity for fresh bulls to step in and take on the top of the range, which they did, in just two sessions. However, to be fair, they may have had help. Short-sellers that found themselves staring into oncoming traffic rushed to cover their positions. In other words, the same traders who introduced supply into the market have now increased demand, whether they wanted to, or not.
However, therein lies the potential trap. If these are the dynamics driving the current move, once the short squeeze is exhausted, demand will suddenly drop, and with it, gold prices. From a chart perspective, the flag breakout achieved about two-thirds of its implied target, ripening the move for a pullback to retest the flag.
Also, the larger range, in place since April 14, may be followed by a return-move—that’s gravity now coming from two patterns that may pull the price back. What’s more, the price of gold is currently testing the April 14 high, the point from which it plunged nearly 7% within six sessions.
Some traders may remember that and think this would be a good shorting opportunity, potentially turning this into a double-top. One glaring reality catches our attention: all the news and commentary on gold is positive. That always makes us uncomfortable. Perhaps whoever is buying is all tapped out, leaving a vacuum and a setup for at least a corrective dip, if not an outright reversal.
Therefore, while gold could keep going up in a straight line, it might also pull back before attempting to rally further. We don’t know. But trading is not about knowing, it’s about calculating risk and attempting to stay on the side of statistics.
Trading Strategies
Conservative traders would wait for a retest of the range, if not the flag, for confirmation of support, before establishing a long position.
Moderate traders, too, would wait for a pullback to establish a better point of entry, rather than for proof of the trend.
Aggressive traders might enter a contrarian short position, provided they read—and understand—this article, accept the risk and will know and manage the trade accordingly, in a way that fits their budgets.
The following is a trade sample to know what to pay attention to in a trade plan. Feel free to tweak it to fit your personal preferences.
Trade Sample – Contrarian Short Position
- Entry: $1,790
- Stop-Loss: $1,800
- Risk: $10
- Target: $1,760 – range top
- Reward: $30
- Risk-Reward Ratio: 1:3
