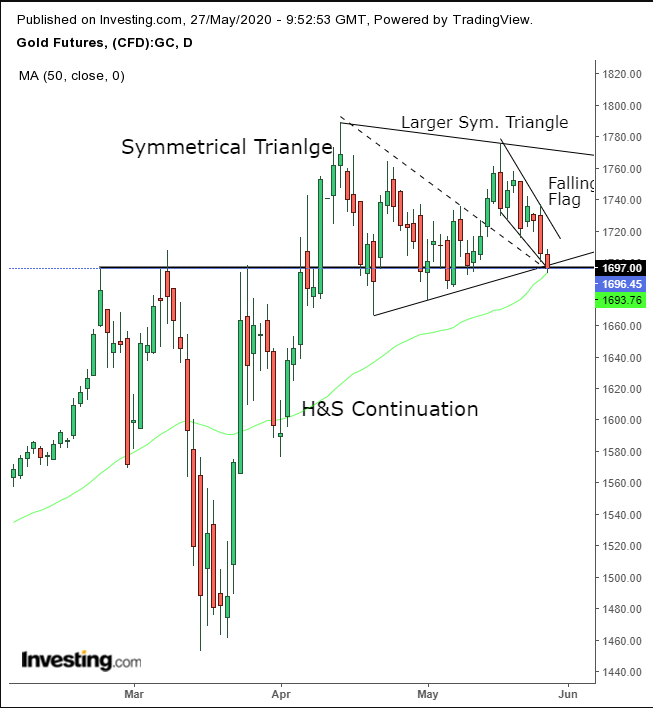
We have been bullish on gold since April 7, when the precious metal completed a bullish pattern. Since then, we've reiterated that call in a number of posts.
Yet it’s been 50 days since our initial read on the yellow metal's direction and the price remains flat. So what gives?
Fundamentally, gold's initial 20% surge between March 16 and April 7 was due to its safe haven status, following the panicked equity selloff. However, we expect another rally, though this one will be triggered by falling rates, which make Treasurys less attractive—compounded by reduced gold supply as mining deposits grow thinner.
US rates are near zero and even in the US there's now speculation of negative rates as the Fed prints money at unprecedented levels, aiming to “flood the system with money.” Moreover, Neel Kashkari, President of the Minneapolis Fed clearly said that “there is no end” to the Fed’s ability to print money. On the other hand you can’t print gold.
Which means, if the stock market does crash as we expected it will, falling in tandem with the real economy, gold should surge on its safe haven status. And even if equity investors are willing to take a leap of faith that the recovery will be swift, gold will strengthen anyway, since, after all, that incredible stock rally would only be due to the central bank's endless largesse.
Gold's technical picture corroborates this move.

We discussed gold's three consecutive bullish patterns earlier this week:
From a technical perspective, the precious metal rebounded at the bottom of a falling flag, bullish following the preceding jump—which is itself an upside breakout of a larger bullish pattern, a symmetrical triangle. Adding to the power of the move, it is an additional, larger upside breakout of a H&S continuation pattern.
In total, three back-to-back bullish patterns, each individually promising a continued rally. The hat trick makes the case for a powerful surge.
All three patterns are being tested now. If the support holds, gold will be forming a fourth bullish pattern, or rather enlarging the second. The second pattern, the symmetrical triangle, will expand with presumably the same dynamics: equally eager buyers and sellers.
The assumption is that even the sellers are bullish but are merely cashing out after profiting from the previous move. Once sellers unwind their positions and buyers are forced to rise above the pattern to find additional supply, the original sellers will come back in for another go-round.
The two previous bullish patterns—the smaller symmetrical triangle and the preceding H&S continuation pattern—lend credence to these expectations. The 50 DMA has realigned with the current price, pointing at the supply-demand pressure point.
While nothing is predictable, which could mean we might witness a series of pattern blowouts, as far as playing the odds go there remains a very strong case for a gold rally. Considering that the price is smack on top of a convergent group of supports, providing a rare, exceptional risk-reward ratio, it makes taking a long position a no-brainer...as long as one trades according to a preset plan that fits one’s budget and, not less important, one's temperament.
Trading Strategies
Conservative traders might wait on a long position for the larger symmetrical triangle to complete with an upside breakout.
Moderate traders may be prepared to invest in gold upon the completion of the falling flag (if indeed it could still be considered as such, returning to the low point of its move).
Aggressive traders would go in now, not only banking on two completed bullish patterns and the 50 DMA but taking advantage of a potentially singular risk-reward ratio.
Trade Sample – Aggressive Long Position
- Entry: $1,696
- Stop-Loss: $1,689 – below whole number of the day’s low
- Risk: $7
- Target: $1,766
- Reward: $70
- Risk:Reward Ratio: 1:10
