Despite some major negative press over the past years, most recently an ugly dust-up with Apple (NASDAQ:AAPL) over a change in the iPhone's privacy settings that could threaten Facebook's lucrative targeted ads business, overall, the social media giant seems to be unstoppable.
The mammoth communications services platform is scheduled to release Q1 2021 results on Wednesday, Apr. 28 after the close. Analysts predict Facebook (NASDAQ:FB) will show EPS of $2.36 EPS on revenue of $23.53 billion. That's a significant improvement from the $1.71 EPS and $17.74 billion in revenue for the same period a year ago, but down from the previous quarter when EPS came in at $3.88 EPS and revenue hit $28.07 billion.
The reflation trade is to blame. Investors have been rotating out of tech and other stocks such as Facebook that outperformed during the pandemic, shifting instead into stocks neglected during lockdowns, which now provide value because of their beaten down prices.
Notwithstanding a lingering antitrust threat, Facebook's digital ad revenue appears to have no where to go but higher. The stock's technicals look equally promising, which could mean traders will be taking FB shares to fresh all-time highs.

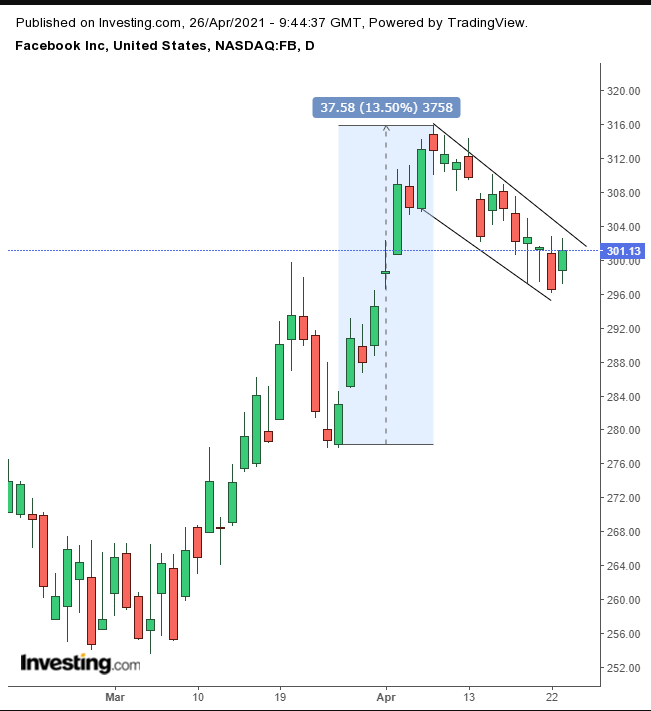
The stock has been in a slow decline from its Apr. 8 all-time high above $315. Note how steep the leg up that preceded the record was—a $37.58 rise within 9 sessions. Conversely, the decline was only $19.83 over a 12-day period so far, about half of the price move within a duration that was 25% longer.
This demonstrates that there is far more interest in the stock rising versus falling. The preceding move is known as a “flagpole,” and the down-tilted range is the body of the “flag.” The pattern is considered a continuation pattern because the obvious upward bias demonstrates that the only reason the stock is retreating is on profit-taking from traders who enjoyed the flagpole rather than because of a consensus on a reversal.
In cases like this, new bulls picked up the shares unloaded by earlier bulls. Once the profit-taking is completed, the new bulls, who still want to make a profit, are expected to raise their bids above and beyond the flag. That's likely to spark a short squeeze, pushing the price up yet further.
When all shorts are covered, a temporary reduction in demand may allow the price to fall again, till traders will become content with the lower price and push the stock up once again, this time even higher. The early bulls who already cashed out may then become angry about their premature exit and rush back in. At the same time, many who were sitting on the sidelines will decide to join the fun. In this way most of the market will end up being on the same side—that of demand.
Notice that the flag found support by the March peak, demonstrating that demand is interested in this uptrend.
Naturally, this is the presumed dynamic expected during this pattern, based on historical behavior. We don’t have a time machine. We're merely weighing the evidence and navigating potential trades. Here’s how to do it:
Trading Strategies
Conservative traders should wait for the flag to complete with an upside breakout and a close at least above $305, and remain above the flag for at least three days, preferably to include a weekend. They should then wait for a return move that retests the flag’s support, before committing to a long position.
Moderate traders would go with an upside breakout of at least one, long, full candle above the pattern on a closing basis, before jumping in.
Aggressive traders could enter at will, if they understand the analysis and the higher risk of not waiting for confirmations of the uptrend, as the price of being two steps ahead of the rest of the market. The more aggressive the approach, the tighter the trade plan should be.
Here’s an example:
Trade Sample
- Entry: $300
- Stop-Loss: $295
- Risk: $5
- Target: $330
- Reward: $30
- Risk:Reward Ratio: 1:6
Author's Note: We do not know the future. We are not saying this will happen. What we are saying is that based on historical price behavior, the odds are in favor of the moves, as we described, corresponding to the various stages of confirmation. Even if we’re right, you can still lose on the trade, if it catches your stop-loss, which you should place based on your timing, budget and temperament. Until you learn how to customize your own trade plans, follow ours, taking small risks, for the purpose of learning, not to make a profit, or you’ll end up with nothing.
