By Pinchas Cohen
Yesterday, as the trading week opened, all three major US indices moved higher. Banks (via NYSE:KBE) led the rallies, while utilities (via NYSE:XLU) were the drag.
On September 11, we posted this on the financial sector, as part of an ongoing series taking a closer look at the S&P 500's 10 sectors. Considering the sudden prominence of the financial sector, the topic warrants an additional, deeper look.
Fundamental Analysis
As investors continue to disregard geopolitical risk coming out of North Korea, their focus shifts to the Fed policy meeting tomorrow, 14:00 EDT.
Whereas the consensus assumes no change in interest rates, guidance regarding the path of future interest rate hikes and balance sheet shrinkage is expected. And after the recent CPI upside surprise, investor optimism regarding the possibility of a December hike might have egged investors to keep buying shares at ever higher prices.
The market narrative says that higher interest rates would benefit banks, because of both higher profit margins and higher yields on bond holdings, which is where 92.5 percent of their $4.5 trillion assets are. On the other hand, utilities fell, as rising yields renders defensive stocks, also considered Treasury proxies, moot. As well, both sectors moved with a close negative correlation, as the bank stocks enjoyed a 1.17 percent rise at the 1.02 percent expense of utilities.
Similarly, because of a higher interest-rate outlook on Trump’s supposed reflation, the bank index rose exactly twice as much as its benchmark, the S&P 500 Index (25.8 percent versus the SPX 12.9 percent) from the day of the election results until the end of the Trump-trade in March.
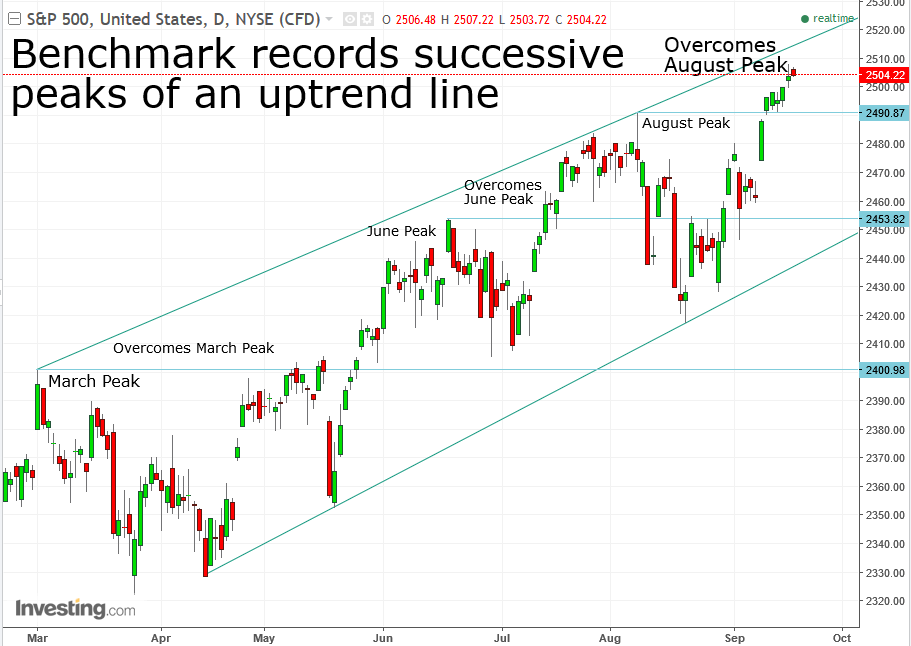
However, if in fact an outlook for higher interest-rates benefits the profitability of banks, why is it that since March, the banks were left behind, while the SPX continued to climb 4.3 percent higher? Why did banks not merit the climb higher that leading indices enjoyed, instead of being the leader of these indices – despite the most successful stress test results since the Great Depression, followed by Fed approval for banks to conduct enormous buybacks?
S&P 500 Registers Peaks in a Rising Trend

Perhaps the premise that higher interest rates are tantamount to higher bank profits is misguided. Whereas, since December 2015 effective Federal Funds rose 90 basis points, the banking sector net margin rose only 10 basis points. The miscalculation that banks will surely profit more with higher interest rates is that they too will have to pay these higher interest rates. On the other hand, between 2010 and 2016 interest rates were at an all-time low, yet bank profitability grew during that period.
What Does Supply-Demand Analysis Reveal?
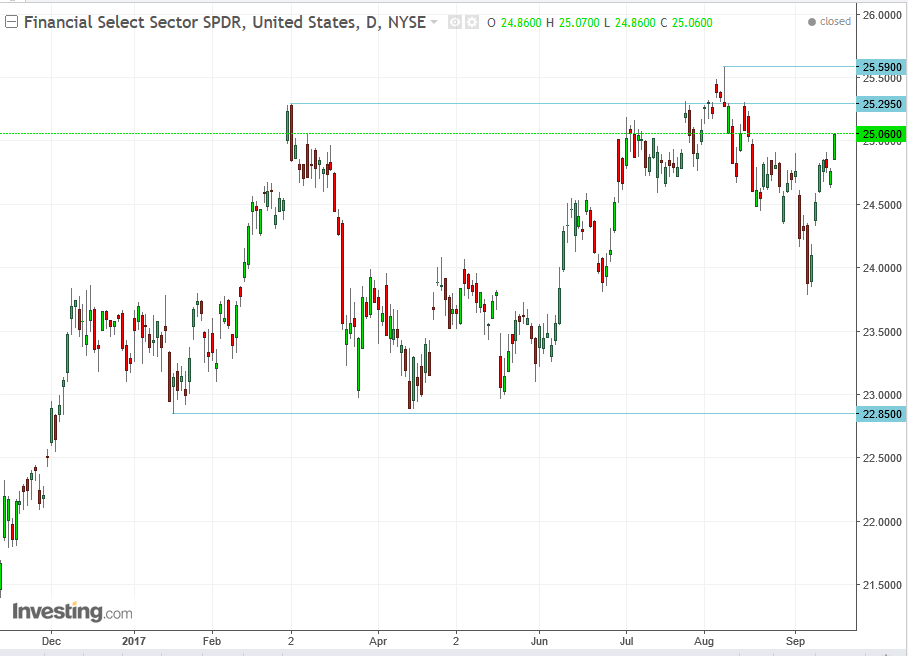
As stated above, as opposed to the benchmark index, the financial sector (via NYSE:XLF) is now lower than where it was in March, when investors stopped putting their faith (or money) in Trump’s reflation, which would have forced (in a positive way) the Fed to shift gears to higher interest rates.

The trend is up in the short term since the 8th and has been trendless since March. Only when the price will fall below $24.60 will it be possible to call an end to the short-term rising trend and only below $22.85 allows for the potential of a long-term trend reversal.
Meanwhile, the price’s approach to the $25.00 level raises the probability of rising sell orders, from where prices fell 6 to 9 percent. A short position provides an attractive risk-reward ratio, as the price is closer to those levels which are thought to hide waiting sell orders, than those levels which are thought to harbor buy orders.
Trading Strategies
Conservative traders would wait for a close below $24.60, before entering a short position.
Moderate traders are likely to wait for a price closer to the $25.50 resistance, as well as for its confirmation with a retreat below $25.00, on a close, before entering a short position.
Aggressive traders may short now, with a stop-loss above the $25.60, August 8 high. This exposes them to a $0.55 risk. That means that they must allow their position to ripen with at least a $1.26 decline to the September 7, $23.80 low. This provides the 1-2.3 risk-reward ratio, which is OK. However, traders who’d allow the position to ripen further until it reaches the bottom of the range of this year at $23, will earn the attractive 1-3.75 risk-reward ratio.
When the price reaches or even nears the $23.00 level, it is expected to attract buyers, who remember the June 23-August 8, 7.5 percent rally, as well as the 5.5 percent advance since the 7th – from $23.80.
Should the price decisively cross below the 22.80 support, it is expected to shed another couple of bucks.
(Traders may combine between the risk levels, according to a broader strategy that includes myriad risk levels.)
