Bitcoin is rising for the third straight day. That's impressive considering the current lack of consistency among all asset classes.
Perhaps even more impressive are the cryptocurrency's recent moves: since the March bottom, the S&P 500 Index is up almost 30%, gold has barely gained 17% and oil is flat after doing something most people never thought possible, plunging below zero to -$40 at one point—on a closing basis, no less. Over the same period, Bitcoin has added a whopping 132%.
There is an argument currently being made that Bitcoin is going to keep rising. This is particularly salient since the largest cryptocurrency by market cap is on the cusp of a significant event—its upcoming halving, which will occur in just four days. What this means: the payout that miners receive will be cut in half, beginning as soon as May 12.
Joseph Young writing in Cointelegraph notes:
“Historical data shows that when the long-term price trend of Bitcoin shifted at a local bottom with a strong reaction from buyers, it saw an extended uptrend.”
He expects a minor pullback post-halving, followed by a medium-term and longer term series of rallies for what has also been called by some an “epic rally.”
We recognize that Bitcoin is at a crucial intersection, but unlike Mr. Young's certainty, we require additional price action in order to help us develop a stronger opinion. From our perspective, via Bitcoin's technical chart, the collective investor hasn’t decided in which direction Bitcoin should be heading next.

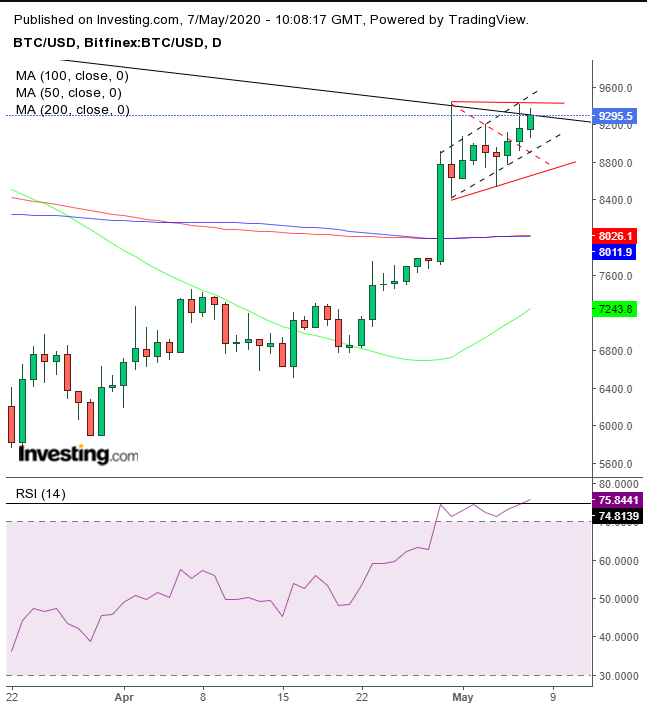
The digital currency is struggling for the third day out of eight, to bypass the top of a falling channel, in place since June. Should prices continue to trade according to the falling channel, they will retest the March lows at the $4,000 levels. But, if they break to the topside, we can expect them to retest the $14,000 levels, below where Bitcoin began developing that falling channel in June.
When two trends collide, as is the case here, either can become dominant. Overall, the longer-term trend is expected to garner more interest, overcoming the shorter one.
However, traders—and open minded analysts—must always allow for the possibility of a reversal. They do occur. Still, the current market environment dramatically increases uncertainty. While any pause in the trend can be viewed as indecision, this one seems to us to be much more dramatic.
Look at how many ways we can interpret the range Since April 30. Did the price complete a pennant (dotted red line), suggesting another leg up—which could still possibly be blocked by the downtrend line since June—or is the range continuing to drift (solid red lines)? As well, we can’t ignore that almost all the price action occurred within the dotted black lines.
Perhaps the RSI can make the picture clearer? Not necessarily. It made another high since April 30, which is even more elevated than the February highs.
Does this suggest that prices too would track beyond the $10,000 psychologically imperative level which they did less than three months ago? We don’t know.
We’re also considering that the RSI is the most overbought since June—that’s right—when the falling channel began developing, leading to a monumental drop of $9,7630, or almost 71%. On the other hand, the March lows might have found support by the December 2018 to April 2019 bottom, which could potentially bounce prices out of their falling channel.
Therefore, we wait for either an upside breakout of the falling channel, followed by a close above the $10,000 key level, or alternatively for a fall below the current range, increasing the likelihood of a short-term reversal, back toward the March lows.
Trade Strategies
Conservative traders would wait for either an upside breakout of the falling channel followed by a base above the $10,000 round, psychological price, for a long position, or for two peaks and two troughs in a downward formation, to confirm a resumption of the underlying downtrend, since the June high.
Moderate traders may go long with an upside breakout, followed by a pullback, not necessarily for confirmation but for a better entry. Alternatively, they could short with a downside breakout of the range, preferably to include the uptrend line since the March bottom, followed by an expected return move, for a better entry point, if not for proof the long-term trend remains intact.
Aggressive traders may enjoy a short with an exceptionally rare minimal risk relative to the reward, as the price is retesting the top of a falling channel.
Trade Sample - Short Position
- Entry: $9,300
- Stop-Loss: $9,500
- Risk: $200
- Target: $8,500 – above the short-term uptrend line
- Reward: $800
- Risk:Reward Ratio: 1:4
