Gold made history yesterday and continued to do so again today. The yellow metal broke the $2,000 milestone and psychological barrier on Tuesday, then continued soaring well past that landmark during Wednesday trade.
While there has been much talk—including in some of our previous posts—about how shares, since the mid-March slump, have been executing one of the greatest equity rallies of all time, at the end the day, stocks are flat for the year. At the same time, gold is up a whopping 25%...and at the time of writing, accelerating.
The precious metal tends to do well when interest rates are low, increasing inflation risk. Gold is also the oldest known hedge against unprecedented market uncertainty, something that's front-and-center now, amid the worst global pandemic seen during the lifetimes of pretty much anyone alive today.
Nonetheless, though we cannot know that gold won't continue to climb based on its safe haven status, along with possible gold-rush 'fever' among retail investors, consider this post a warning. We’re concerned that institutional investors, or the “smart money” as they're sometimes called, will begin divesting out of the yellow metal in order to find alternate safe havens that might provide better value for their invested dollars.
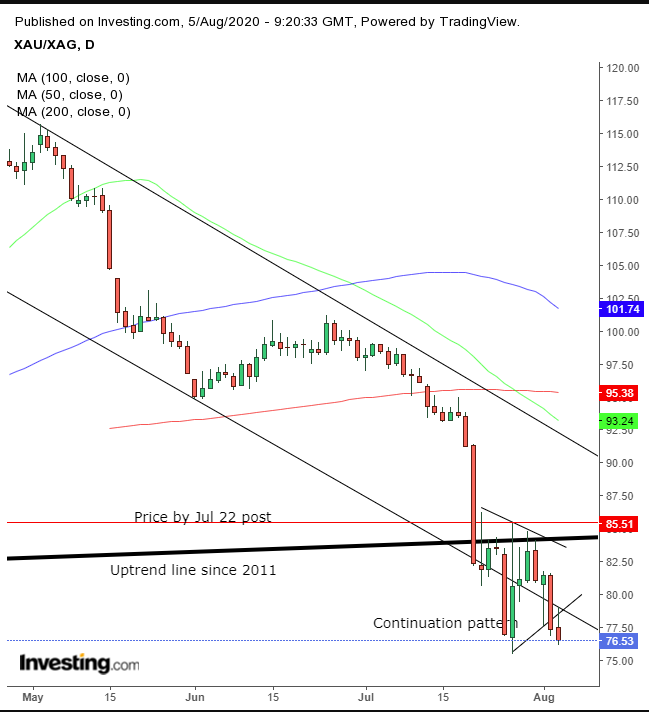
With that in mind, today we're revisiting something we posted on July 22. At that time, we forecast that silver would outshine gold. And that's exactly what happened—by a handsome 11.5%. Plus, we strongly believe silver will continue to gain on gold.

Above is the Gold/Silver Spot Ratio chart, whose price is the difference between the two precious metals. Since our July piece, the ratio has fallen below its uptrend line since 2011 and immediately developed a pennant—a continuation pattern—suggesting new investors are stepping in to pick up the profit-taking.
On Tuesday, the ratio closed slightly below Monday’s candle, which hammered out the bottom of a bearish pennant that caused a Death Cross, at the bottom of a falling channel, as well as the pennant. Today, the ratio extended that pattern breakout, demonstrating that the downturn that was, until now, within a falling channel, is about to take a steeper dive.
So, if you feel you must invest in a haven asset, consider silver instead of gold.

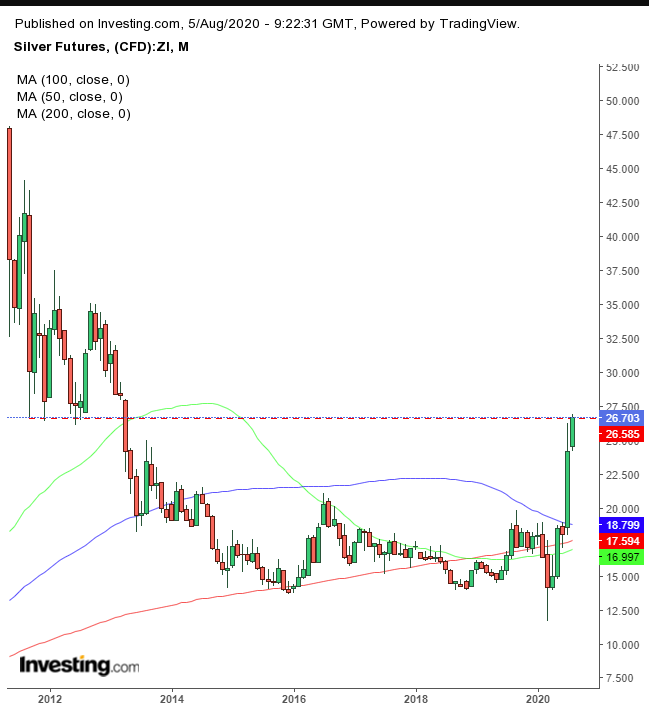
However, even silver, after jumping to its highest level since March 2013, was stopped by the 2011-2012 lows.
Therefore, if you enter a long position, be prepared for a pullback.

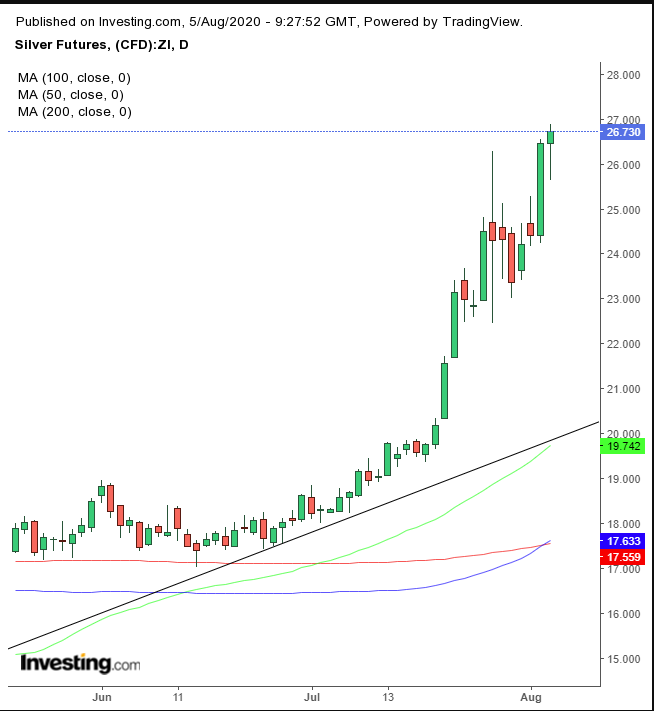
Today’s candle is forming a hanging man. That's bearish if tomorrow’s candle closes below today’s real body.
Trading Strategies
Conservative traders would wait to buy silver upon a correction to the uptrend, currently at $21, and a bounce providing evidence of demand.
Moderate traders may buy silver upon a return to the bottom of the July congestion at $23.
Aggressive traders might short silver if today’s candle closes as a hanging man and tomorrow’s candle closes below today’s.
Trading Sample – Aggressive Short Trade
Entry: $26.50, upon a retest the hanging man’s resistance
Stop-Loss: $27 – above the hanging man
Risk: $0.50
Target: $25.00 – round, psychological number and the top of the July range
Reward: $1.50
Risk:Reward Ratio: 1:3
