Earlier this week the market narrative said the S&P 500 was slipping because U.S.-China trade talks appeared to have stalled. Yesterday’s drop was attributed to the Commerce Department's release indicating that the U.S. trade deficit had hit a 10-year high in 2018.
That pushed the benchmark index to its lowest level since Valentine's Day. The market's fundamental drivers may not be clear, but technicals are signaling the uptrend is weakening.

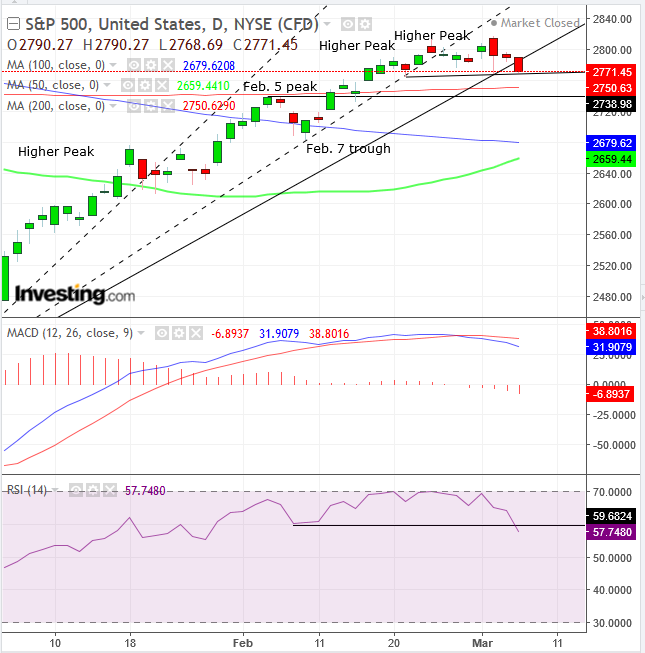
The SPX's price has crossed below the third uptrend line since the pre-Christmas rout. Typically, once three trendlines are violated, the uptrend could end.
Uptrend lines are drawn after a new peak. Once that uptrend line is violated, a fresh uptrend line is drawn when a new, higher peak is registered. Therefore, Monday’s 2,816.88-intraday high—higher than the 2,813.49 peak formed on Feb. 25—justified a new, third uptrend line, even though it was touched only once since the bottom.
After the SPX fell below the third uptrend line, drawn Monday, it found support by the trend line drawn by the price congestion’s lows since Feb. 21. The trendline is supported by the 200 DMA which is 0.6% below it.
A close under 2,770.00 would demonstrate supply had overwhelmed demand, at the supply-demand dynamic, at current levels. However, a reversal would be more likely after closing below the 200 DMA, whose support-resistance synchronized with that of the Feb. 5 peak.
Both MACD and the RSI fell after reaching overbought levels, adding to the bearish outlook. The RSI also provided a negative divergence, falling below the Feb. 7 trough, suggesting prices may follow. Keep in mind, however, that while the uptrend is getting weaker it is still pointing higher, until the price carves out a descending peak-trough formation.
Trading Strategies – Short Position Setup
Conservative traders will wait for a trend reversal before committing to a short position.
Moderate traders may risk a short entry after the price closes below the 200 DMA.
Aggressive traders may enter a short position with a close below the trendline, drawing the lows of the congestion.
Trade Sample
- Entry: 2,765
- Stop-Loss: 2,770
- Risk: 5 points
- Target: 2,740, above the February peak
- Reward: 25 points
- Risk-Reward Ratio: 1:5
