Stocks have been rallying on hopes that the world’s two largest economies, the US and China, might finally put to rest their trade differences. Talks between the economic superpowers were extended for a third day, today, on reports their differences have narrowed.
A resolution to the lingering trade dispute would help mega caps since these multinational companies rely on exports to boost revenue, which would decrease on the burden of rising tariffs. At first glance, this narrative could explain why the NASDAQ Composite gained 1.08% yesterday.
So why then has the small cap Russell 2000, an anti-trade proxy, outperformed during this current rally? If tariffs are set to ease on a resolution to the trade spat, small caps should fall as the smart money moves back into large caps.
Though oil price volatility and Fedspeak have had an impact on energy and financial shares respectively, it's been technology stocks that have been leading the broader market higher—and lower. They're particularly sensitive to positive trade developments, often suffering significant selloffs on trade setbacks.
Why then wouldn't the tech-heavy NASDAQ be the current rally leader? Perhaps informed money knows something the rest of us don't?
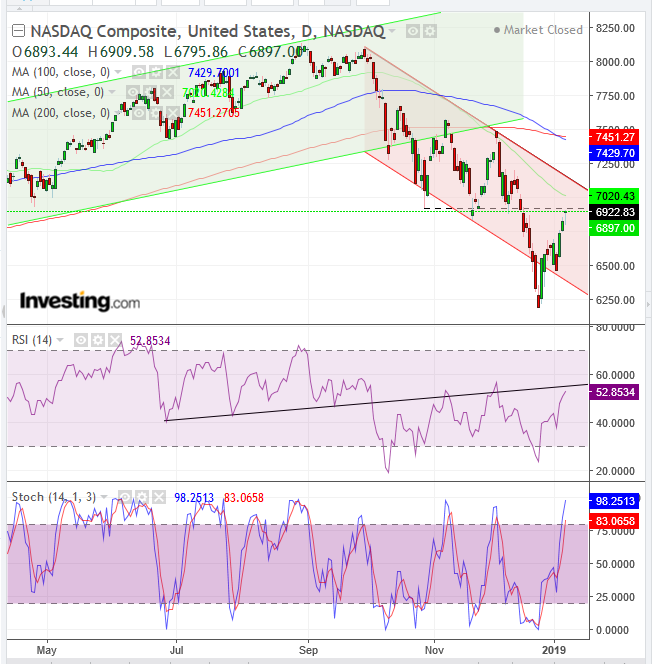
Could it be they aren't buying into the possibility of an actual deal? The NASDAQ Composite's technicals certainly signal that could be the case. Tech shares are about to lead the market lower yet again.

Yesterday, trading on the NASDAQ Composite formed a Northern Doji, which is also a Hanging Man. Both variations—combined in one candle, in this instance—follow a rally. The Northern rally suggests the market is overbought, as bulls run out of steam.
While in itself that doesn't necessarily mean an immediate price reversal, it suggests that, as the Japanese say, the market is tired. It indicates that the rally is vulnerable and that other factors may weigh on the rally, slowing or even ending it.
When additional technical signals emit alerts, especially at important market junctures, the bearish implication of a Northern Doji is amplified. In this case there are six things to be aware of:
- A Northern Doji presumes an overbought market and stochastics are indeed overbought.
- Additional indicators supporting a reversal: the Northern Doji in the form of a Hanging Man, a candle as ominous as it sounds, when confirmed with a lower close in the following session, leaving the bulls “hanging.”
- The RSI is making its fourth attempt to overcome its resistance line, previously its support line, as momentum flipped, along with the creation of a descending channel, following an ascending channel.
- The 100 DMA just crossed below the 200 DMA, showing prices slowing down—though the 50 DMA recently crossed above the 200 DMA, triggering a Golden Cross, suggesting prices should go higher. We have been seeing such market dichotomies, which project the precarious position of a market on the edge of a knife, one that could still resume its bullish trajectory. However, should it fall just a little, the bear will eat the bull's lunch.
- The doji developed at the October-December, support-turned-resistance line as the supply-demand balance shifted, and
- As the price nears the top of the descending channel since October
Whether because of trade talks not succeeding or another as yet unknown reason, the NASDAQ Composite is showing broad and deep weakness.
Trading Strategies – Short Position Setup
Conservative traders would only bite if the upward correction is full, reaching the channel top, followed by at least one long, red candle engulfing a green or small candle of either color. Then, they’d wait for a pullback, for an entry closer to the resistance and their stop-loss, to reduce exposure and increase risk-reward ratio.
Trade Sample
- Entry: 7000
- Stop-loss: 7020
- Risk: 20 points
- Target: 6800
- Reward: 200 points
- Risk-Reward Ratio: 1:10
Moderate traders might risk a short without waiting for the price to retest the channel top, if the price closes lower later today. Then, they may wait for a retest of yesterday’s high, for a better entry.
Trade Sample
- Entry: 6900
- Stop-loss 6910
- Risk: 10 points
- Target: 6800
- Reward: 10 points
- Risk-Reward Ratio: 1:10
Aggressive traders may enter a short immediately.
Trade Sample
- Entry: 6900
- Stop-loss: 6910
- Risk: 10 points
- Target: 6800
- Reward: 10 points
- Risk-Reward Ratio: 1:10
