WTI crude has fallen due to investors rotating out of risk and the stronger dollar. Hedge fund managers reduced week-long positions on US crude to the lowest level in over a year, according to the US Commodity Futures Trading Commission on Friday.
Additionally, US production increased by almost a third from its 2016 bottom, to roughly 11 million barrels per day. Moreover, the outlook for output stateside is expected to rise as drillers added two oil rigs last week, a third consecutive rise to a total of 875, the most rigs since March 2015, according to Baker Hughes energy services on Friday. All of this paints a bearish picture for crude.

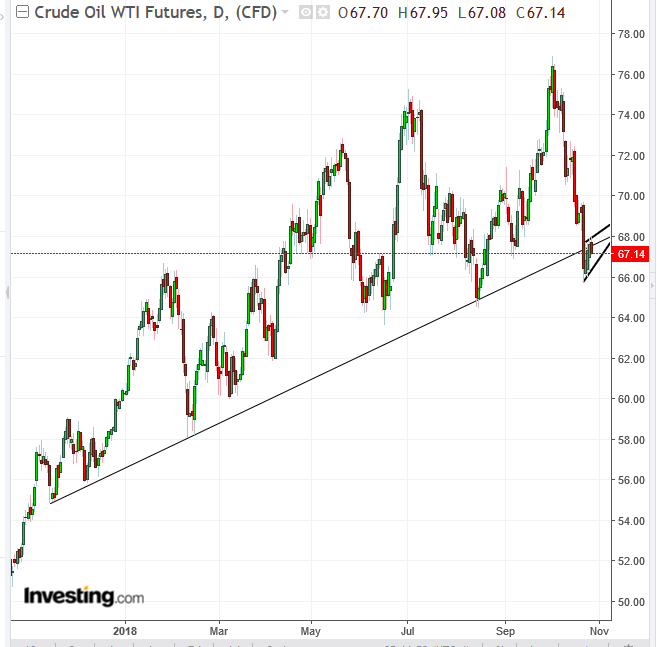
The price is over 12 percent lower than its October 3 high of under $77. It has been consolidating for the fourth day, after Tuesday's 5-percent plunge. The consolidation pattern is in the shape of a rising flag or pennant. This pattern is presumed to be bearish after following a decline, as this one has. The mechanics behind the bearish expectancy – on a downside breakout – are that all the demand has been absorbed and traders lower their offer rates, as they grow desperate to get out of a losing position.
The pennant's representativeness of the supply-demand balance is in the fact that it's happening where the uptrend line since November 15 and the 200 DMA cross paths. If three individual events meet at the same time and in the same price level, it is hardly a coincidence.
It's important to note that should there be a downside breakout that fulfils its minimum target – the previous sharp move – the breakout will fall to the lowest level since April and below both the August and June troughs, completing a reversal. While the pennant's derived price objective is based on measuring the Thursday 5-percent plunge, it is calculated from the point of breakout. Our point of the breakout was merely an estimate. Therefore, adjust the price target according to the price in which the pennant bottom was penetrated. A top reversal, with a trough, posted lower than $64 would suggest an $8.56 further decline toward $56.
Trading Strategies – Short Position Setup
Conservative traders would wait for the trend to become clear, with either a peak higher than $77 or a downside reversal.
Moderate traders may short upon a downside breakout of the pennant of 3-percent, following a return move that confirms the resistance of the pennant, the broken uptrend line since November 2017 and 200 DMA hold, as supply overcomes the temporary demand created by stop-losses triggered, in addition to traders on the wrong side of the market. A minimum confirmation of the downtrend is one long, green candle following a red or candle of any color after a rebound toward the pennant.
Trade Sample:
- Entry: $68, after a 3-percent downside breakout and successful return move.
- Stop-loss: $69
- Risk: $1
- Target: $65, round psychological number and support level since June.
- Risk-Reward Ratio: 1:3
Aggressive traders can short now (or upon an intraday rally), relying on the fall from the pennant top, broken 13-month old uptrend line and 200 DMA.
- Entry: $68
- Stop-loss: $69
- Risk: $1.00
- Target: $65, round psychological number and support level since June.
- Risk-Reward Ratio: 1:3
Note: The entries and exits for both moderate and aggressive traders were identical. The risk difference was in the confirmation of the downtrend. Risk can also be according to the distance of the stop-loss and profits.
