There is something inherently wrong with this market. In a healthy market, stocks and bonds maintain a negative correlation. When stocks rise bonds tend to fall, and vice versa.
The logic is simple. When investors seek growth, they are willing to take a risk on stocks; when they seek security, they buy bonds. However, recently, in what seems to contradict all common sense, there's been a selloff in both types of assets.
This must mean that investors are focused on the impact of higher borrowing costs as interest rates rise, which is negative, rather than the growing economy, which is positive. This paradigm shift, in which both stocks and bonds fall in unison, leaves investors exposed, upending diversification strategies which are supposed to be in place to hedge loss in either market.
As such, investors may unwind positions, selling both asset classes. Moreover, the outlook for yet higher rates makes current longer-term yields relatively unattractive. A good way to profit off this strange market is with the iPath US Treasury 10-Year Bear ETN (NASDAQ:DTYS).

DTYS is a contract that allows traders to short the underlying 10-year Treasury note. Another way of looking at it is that this ETN tracks yields, which possess an inverse relationship with their bonds.
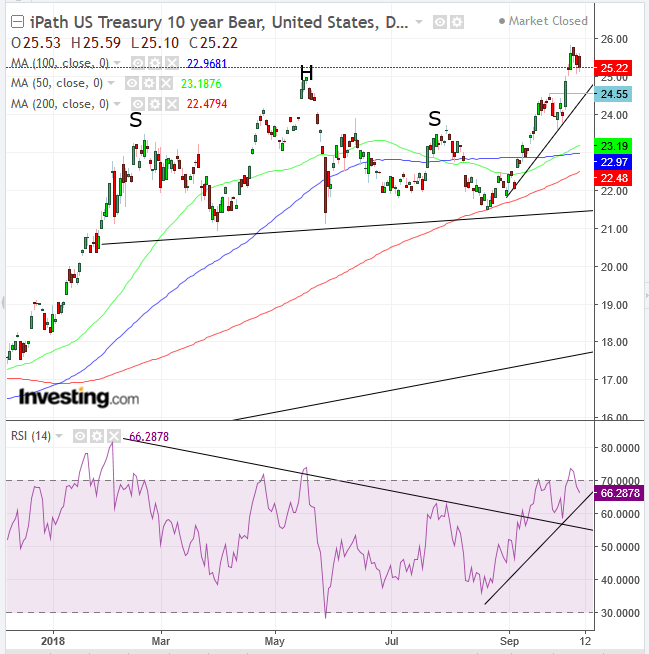
10-year notes have blown out of a H&S top. This reflects the reversal in which yields catapulted, along with the ETN that tracks them, as traders attempted to unwind and reverse positions. After a three-day retreat, the ETN found support by the mid-May peak, the failed pattern’s head.
The 50 DMA crossed back above the 100 DMA, entering a bullish formation, in which the shorter the MA, the higher it is, demonstrating that the more recent the price, the higher it is.
The RSI crossed above the negative correlation to the price, with divergent peaks in February and May. The momentum gauge retested the broken downtrend line early in the month and rebounded, producing a higher peak, forming an RSI uptrend line.
Trading Strategies – Long Position Setup
Conservative traders should wait for a return to 24.55, providing a triple support: (1) the round, psychological number, (2) the uptrend line, and (3) the late-September peak. Then, they would wait for consolidation, with at least one long green candle.
Trade Sample:
- Entry: 25.00, after producing a long, green candle
- Stop-loss: 24.45
- Risk: .55
- Target: 25.75
- Risk-Reward Ratio: 1:3
Moderate traders may wait for a return toward 24.55 for a better entry, but not necessarily for confirmation of the uptrend.
Trade Sample:
- Entry: 24.55
- Stop-loss: 24.45
- Risk: .10
- Target: 25.75, below Friday’s peak’s resistance
- Reward: 1.20
- Risk-Reward Ratio: 1:12
Summary: The moderate trader assumes a higher risk than the conservative trader, lacking trend confirmation. That’s why he increases potential returns.
Aggressive traders might enter a long position immediately, with a close stop-loss.
Trade Sample:
- Entry: 25.10
- Stop-loss: 25.00
- Risk: .10
- Reward: 25.75
- Reward: .65
Summary: The aggressive trader has less potential reward than the moderate trader, as he wouldn’t wait for a potential deeper correction in fear of losing the trade if there isn’t one.
Which stock should you buy in your very next trade?
With valuations skyrocketing in 2024, many investors are uneasy putting more money into stocks. Unsure where to invest next? Get access to our proven portfolios and discover high-potential opportunities.
In 2024 alone, ProPicks AI identified 2 stocks that surged over 150%, 4 additional stocks that leaped over 30%, and 3 more that climbed over 25%. That's an impressive track record.
With portfolios tailored for Dow stocks, S&P stocks, Tech stocks, and Mid Cap stocks, you can explore various wealth-building strategies.
