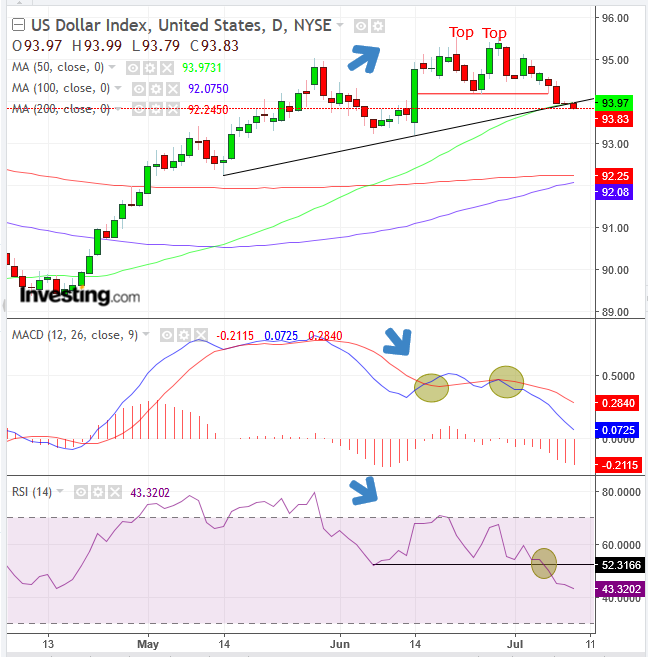
he dollar extended its selloff today, which started after Friday's US Nonfarm Payrolls data showed that while the US economy created more jobs than expected in June, a critical inflation indicator fell. Average hourly earnings missed on all expectations.
Earnings rose 0.2 percent, falling short of the 0.3 percent estimate; Year-on-year growth was also lower than expected coming in at 2.7 percent, rather than 2.8 percent forecast. The slower wage growth was seen to ease the pressure on the Fed from its recently faster than predicted path to rate hikes, but could signal inflationary pressures, which weighed on the USD.

After reaching its highest level since October of last year, traders may be feeling the dollar has become overpriced. Supply has overcome demand, demonstrated by the completion of a small double-top, which occurred on Thursday, when price crossed below the neckline (red line), formed by the previous low of June 25, at 94.21.
Today's weakness pushed below an uptrend line since May 14 and the 50 DMA simultaneously. The coinciding technical gauges demonstrate this price level as a crucial supply-demand pressure point, whose violation may be a catalyst for a sharper move ahead.
Both the MACD and the RSI provided a heads up to indicate the possibility the rally was ending, forming negative divergences when they failed to follow prices from mid-June higher. Both have now triggered additional sell signals.
The MACD's shorter MA crossed below its longer, June 25 MA, retesting the longer, June 28 MA, and since June 29 has plunged, demonstrating how recent prices are weakening relative to more extended price data.
Momentum is breaking down as well, as demonstrated by the RSI as it fell below its early June troughs, suggesting prices may be heading the same way.
Trading Strategies – Short Position Setup
Conservative traders would wait for an official reversal when two peaks and troughs form a descending trend, below the 93 level.
Moderate traders may be satisfied with a close below the uptrend line, after the small double top. They might wait for a potential return move, be it for confirmation of the resistance or a better entry.
Aggressive traders may enter a short now.
Equity Management
Failing to formulate a reasonable, consistent trading plan – the more practical aspect of the excitement of trading – is the single most substantial obstacle for long-term trading success. It is crucial that traders plan entry and exit, to provide them with a minimum of 1:3 risk-ratio, to get on the side of statistics, before entering a trade.
Trade Example:
- Entry: 94.00
- Stop-loss: 94.25, above double-top neckline
- Risk: 25 pips
- Target: 93.20, the June trough
- Reward: 80 pips
- Risk-Reward Ratio: 1:3
