For the better part of four months, investors have been inundated with negative predictions of how a trade war between the world’s two largest economies and biggest trading partners would affect the first synchronized global growth in a decade. The consensus is that the more disruption there is to global trade, the slower the economic growth.
However, if we are to believe the balance of supply and demand, it appears that investors are mostly disregarding those negative assessments. While the market is likely to be volatile in the near to midterm, recent price action suggests traders are turning more bullish notwithstanding simmering trade issues.
There are several reasons why investors may have overcome trade anxieties. The first reason is that investors believe if there will indeed be a trade war, its impact will be limited, especially in the face of economic growth and positive company profits. The second reason is that most market participants believe there won't even be a trade war in the first place. There is a good chance that most people assume Trump is merely playing to his electorate with talks of a trade war. His demands are too unrealistic; China can neither force its citizens to buy more American products, nor can the US meet the required demand to balance trade.
Finally, any increased Chinese demand for American goods would accomplish nothing more than siphoning away the same amount of exports to other countries, leaving the overall current account balance unchanged. Trump's advisers understand this.
The reality is that there's greater US demand for cheap Chinese products than Chinese demand for expensive US products. Nothing can change that according to the current dynamic, and all of Trump's trade war rhetoric seems to be an attempt to check the box next to another campaign promise.
Yesterday, we demonstrated, via the S&P 500, that investors are bullish about the market irrespective of a trade war resolution. Today, we will provide supporting evidence based on Industrials, the sector most sensitive to a trade war.

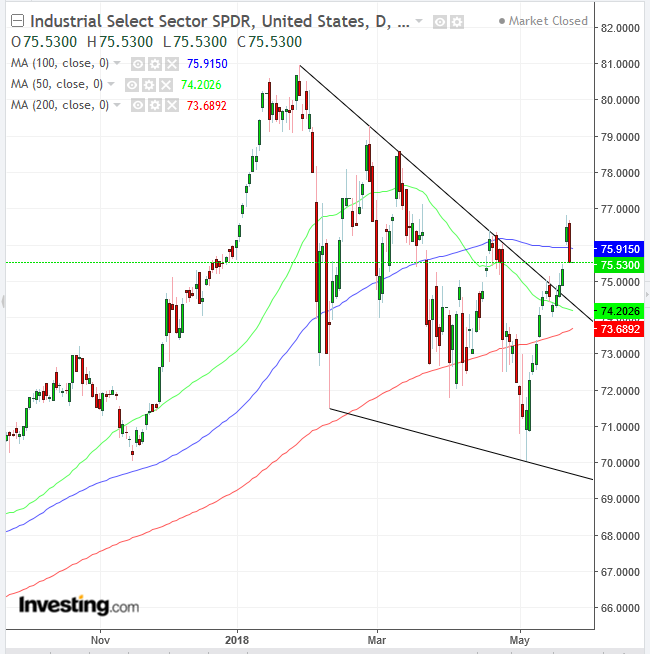
Industrial shares (via Industrial Select Sector SPDR (NYSE:XLI)) dropped 1.23 percent yesterday, second only to Energy’s 1.33 percent, as investors took profit after a 9 percent jump in a little over a month, after a breakout of an ascending channel spanning late January to early April.
Yesterday’s price action for Industrials was wholly bearish, almost wiping out the preceding day’s 1.45 percent, after Secretary of Treasury Steven Mnuchin said that the trade war is on hold. Still, it should be considered nothing more than a correction, a return move to a continuation, falling wedge, after a 2.8 percent penetration, almost satisfying the 3.00, conservative filter to avoid a bull-trap.
A falling wedge occurs when both highs and lows descend but the highs fall steeper. The upside breakout demonstrated that supply has dried out and demand is set to resume within the uptrend since the January 2016 bottom.
While yesterday’s decline fell below the 100 DMA (blue), the rising 200 DMA (red) reveals the biggest supply-demand pressure point, and it's heading to the top of the wedge. Also, while the 50 DMA (green) has been falling, consistent with the falling wedge, it responded to the upside breakout by rising, curving back away from the 200 DMA. Should it continue to rise, it would demonstrate that the most recent price data is rising faster than the oldest price data. The technical jargon is “the 50 DMA would bounce off the support of the 200 DMA.”
Trading Strategies – Long Position Setup
Conservative traders would wait for a 3 percent penetration at 76.91.
Moderate trades would be satisfied with the more than 2 percent moderate filter and wait for a fuller return move to the pattern, as traders cover shorts following the upside breakout, for a better entry.
Aggressive traders may enter immediately, considering they can afford a stop-loss below the 75.00 level of the last, May rally within the pattern, if not the 74.00 pattern support, falling along with the pattern top. Alternatively, they may go long with a closer stop-loss, if they can afford losing the position.
Equity Management
The preceding risk breakdown is categorical, and traders can blend and mix-and-match according to their resources and temperament. It is crucial to develop a consistent strategy and a specific plan, prior to entering the trade, which should be followed through, irrespective of the news. A minimum risk-reward ratio should be 1:3, to provide a higher probability that bigger, winning traders, would offset smaller, losing trades.
Example:
- Entry: 75.00
- Stop-loss: 74.00
- Risk: 1.00
- Target: 78.00
- Reward: 3.00
- Risk-Reward ratio: 1:3
