The Australian dollar was boosted today when employment figures for the land down under were released earlier today. The key Employment Change metric for April was better than forecast—22.6K, which handily beat the 20.3K estimate. Following last month's -0.7K print, traders were euphoric and furiously hit the buy button.
On the other hand the Unemployment Rate stubbornly rose as well, to 5.6 percent, a nine month high, even against the backdrop of 22,600 new jobs added in April.
While it may seem contradictory that both employment and unemployment rise at the same time, the two are reconciled by including the participation rate which was boosted to 65.6, the highest figure for this measure on record, indicating that more Australians want work, thereby expanding the country's labor supply.
Still, even with the near term positive news, the Aussie's longer term outlook isn't particularly rosy.
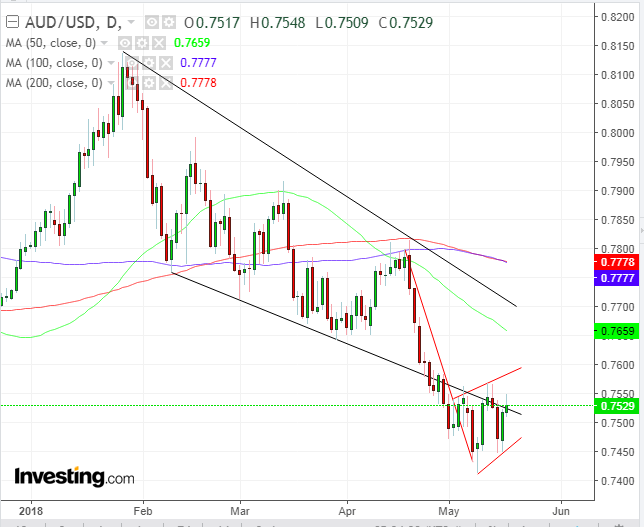
The AUDUSD pair dropped 8.75 percent between the April 19, 0.7814 high and the Aussie's May 9, 0.7412 low.
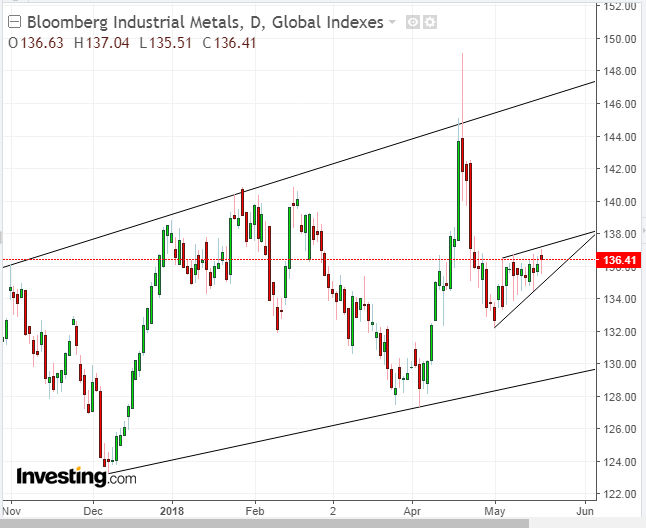
The currency's decline followed the 11.3 percent plunge of the Bloomberg Industrial Metals Index which began on the same day, April 19, as the Aussie fall till its May 1 low. The Australian dollar is extremely sensitive to metals prices, since iron ore is its largest export. The lower AUD price means that foreign importers need to buy fewer AUD with which to pay for the metal.
Both the currency and the metal index are trading within continuation patterns. The Aussie dollar is trading within a bearish Rising Flag while metals are trading within a Pennant.
The 8.75 percent April drop for the AUD over the course of 15 sessions formed the 'flagpole.' It demonstrates a panicked selloff.
The sevens sessions that followed consolidated, representing an after-the-fact assessment, as traders question whether they might have gotten ahead of themselves. A downside breakout would answer 'no' to that question, after which they'd hop on the trade again, going yet further down under.
Notice the location of the flag, beneath a falling channel since January 26, when the Dow and the S&P 500 fell from their record highs. After the Aussie dollar slipped below even the channel support line, suggesting demand dried out, the give-and-take struggle between bears and bulls within the flag is on the channel bottom, a line in the sand.
After the 50 DMA (green) executed a Death Cross, by falling below the 200 DMA (red) and immediately beneath the 100 DMA (blue) in mid-April, the 100 DMA has now found a resistance by the 200 DMA since the beginning of the month. A downturn for the 100 DMA would confirm the bearish outlook on yet another statistical projection.
Target: 400 pip move implied by the flag post, expected to repeat itself, eyeing the 7.100.
Trading Strategies - Short Position Setup
Conservative traders would wait for a decisive downside breakout below the 0.74 trough and the potential return-move, followed by proof that the flag retained its bearish sentiment when at least one long red candle would engulf the preceding green candle.
Moderate traders might be satisfied with a decisive breakout, and while they may wait for a likely return move for a better entry, they wouldn't necessarily wait for confirmation of the pattern's integrity.
Conservative traders may short with a downside breakout, provided they can afford a meaningful stop-loss above the flag-bottom, or assume the risk to their equity.
Equity Management
Enter a position after you calculated at least a 1:3 Risk-Reward ratio, by following these steps:
- Decide where to place the stop-loss, based on the technicals.
- Calculate the risk, the potential loss, relative to your entry.
- Calculate the potential reward target, relative to entry.
- If less than 1:3, avoid the trade. Stay alive to fight another day.
Example
- Stop-loss: 0.7500
- Entry: 0.7400
- Risk: 100 pips
- Target: 0.7100
- Reward: 300 pips
- Risk-Reward ratio: 1:3


