President Donald Trump announced yesterday at 2 PM EDT that he would not sign the waiver agreement that would continue to lift sanctions against Iran. Additionally, the president said that he would make sanctions against Iran even stronger.
Iran is OPEC's third largest oil producer. The country is allied with Russia and China. Russia is already in conflict with the US over Syria which already has its own set of imposed sanctions; China has an ongoing beef with the US over the escalating trade war. Adding fuel to the fire, this withdrawal from the Iran nuclear deal (against the advice of major US allies including France and Germany), makes the most combustible region on the planet (the Middle East) even hotter.
On Monday we discussed various asset classes and how they would be affected in the event of a decision to scrap the Iran deal. While we were right about stronger oil and the dollar, we were somewhat wrong about stocks. So far the S&P 500 has declined a meager 0.3 percent, indicating that Trump's move was already priced in. We were also wrong about gold.
While an escalation in geopolitical tension usually leads to risk-off and investors fleeing to safe havens, it seems another development has been overshadowing geopolitical hazards: 10-year yields have climbed back above the psychological 3 percent level. This is pulling up the dollar, which possesses a negative correlation with gold.
Not only is gold priced in dollars, making it more expensive as the dollar strengthens, but higher yields are a red flag for higher interest rates ahead. Higher rates mean the dollar pays out higher yields, something that gold does not do.
So, is this a good time to sell gold? Not just yet.
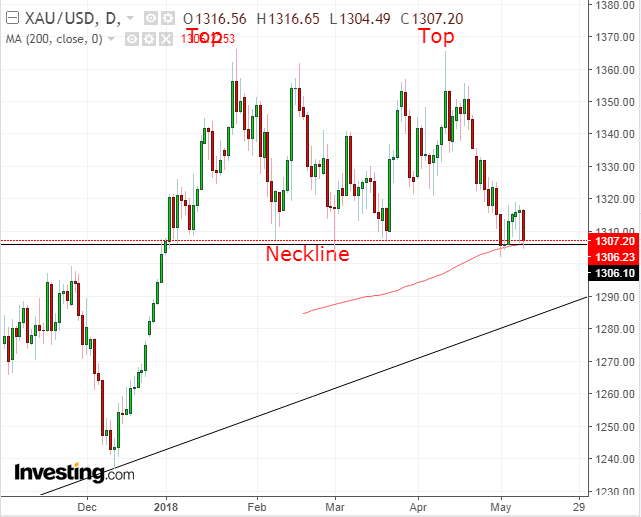
The price of gold is on the verge of completing a double-top. The neckline's significance is underscored by the fact that the 200 DMA is protecting it fiercely. Should the price provide a downside breakout, it would complete the pattern, implying a $60 move further downward, toward $1,245. However, beware the support of the uptrend line since late December 2016, a negative correlation to the downtrend line of the greenback since the same period. The price would have to cross below it, currently at the $1,290 level to resume the downtrend.
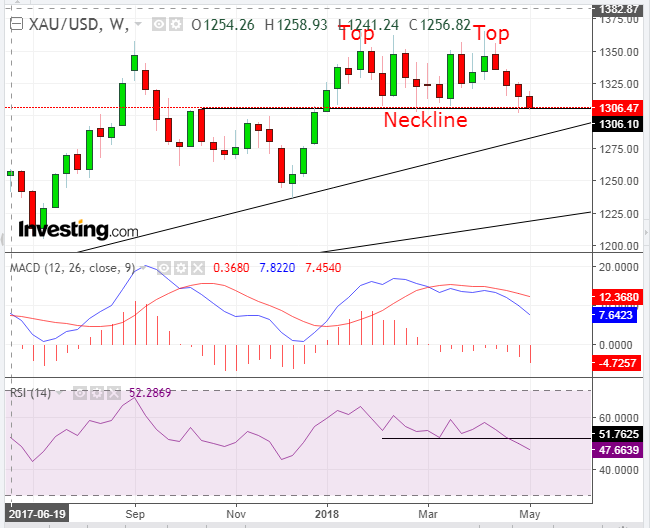
While the uptrend line should keep traders on alert, both the MACD and the RSI provided sell signals.
The MACD's shorter MA plunged lower after two failed attempts in March and April to climb back above the longer MA. This demonstrates that the price data set of the more recent period is falling relative to that of a longer period.
The RSI shows that the momentum has fallen ahead of the price, suggesting that price would follow.
Still, a top has not been established until a decisive breach of the neckline, including filters of varying time and depth to avoid a bear-trap, according to risk aversion.
Trading Strategies – Short Position Setup
Conservative traders would wait for a 3 percent price penetration to $1,266, which would also include a crossing below the uptrend line. Then, they'd wait for a return move to retest the neckline resistance and pattern integrity, with at least one long red candle engulfing the preceding green candle.
Moderate traders might wait for just a 2 percent penetration to $1,279. Then, they may wait for a return-move for a better entry but not necessarily to retest the pattern.
Aggressive traders may short with just a 1 percent penetration to $1,290, but since the uptrend may just catch up with the price, they may want to wait for a potential return move for a better entry and/or to retest the pattern.
Equity Management
Equity management is even more important than analysis. Enter trades only after establishing a plan, including entry, exit and after calculating the risk per capital relative to your account. Enter trades with a minimum of 1:3 risk-reward ratio.
Aggressive Trade Negative Example:
- Entry: $1,290
- Stop-Loss: $1,320 (above May's highest prices' resistance)
- Risk: $30
Therefore, do not enter a position according to this risk, unless it provides a payout of at least $90. Since the target is only $60, providing a 1:2 risk-reward ratio, do not enter the trade.
Aggressive Trade Positive Example:
- Entry: $1,295
- Stop-loss: $1,311 (above the round number price above the neckline)
- Risk: $6.00
Therefore, do not enter a position with a smaller profit than at least $18.00.
- Target: $1,266 (Pattern's implied target, by measuring its height and the assumption that market dynamics would repeat.)
- Reward: $29
- Risk-Reward Ratio: 1:5


