Facebook (NASDAQ:FB) helped save the day for stock investors yesterday. The social media giant crushed it on earnings. It reported a $1.69 EPS, considerably higher than the estimated $135; an $11.97 billion, topping an expected $11.4 billion revenue.
That didn't surprise us since we forecast that advertisers will continue to use Facebook because it's the world's largest social media platform. What did surprise us, however, was user growth. Both daily and monthly active users met expectations. The tech behemoth delivered an additional 48 million daily active users, gaining 3.42 percent in this category, to reach 1.449 billion and 70 million monthly active users, or 3.14 percent, reaching 2.196 billion.
It is worth noting that all these new users joined Facebook after the Cambridge Analytica data breach scandal became public, and despite the severe backlash that resulted.
Are Facebook troubles over? Is it now time to get back into the stock?
Time To Short?
Almost a month ago, we suggested it wasn't yet time to short Facebook stock. However, we now believe that time is at hand.
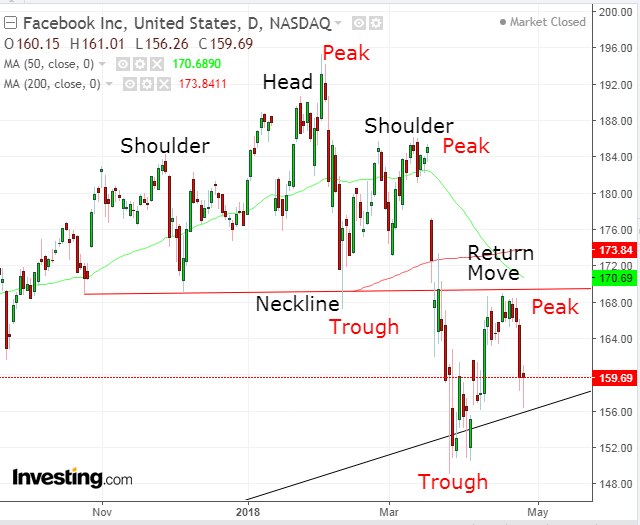
While the price of FB completed an H&S top and closed below its uptrend line since late August 2015, we were concerned that the following decline may have fulfilled most of the pattern's implied target. We also warned against a likely return move. Therefore, we suggested waiting for either the correction that follows a breakout or for an extended decline to its primary uptrend line since 2013.
As the price does in roughly 2 out of 3 breakouts, it retested the top pattern. The neckline provided a precise resistance, which puts a smile on technicians' faces, further confirming the reversal pattern's integrity. Yesterday's earnings beat provided an impressive rebound for the stock, forming a bullish hammer. Despite the initial selloff that occurred before the earnings surprise, price remained above the uptrend line since August 2015, confirming its support.
We consider this bullish behavior the candle's spark before the flame goes out. The 12 percent penetration of the neckline revealed a demand weakness. The neckline's iron resistance confirmed the bearish commitment. The trend had already reversed when the breakout formed a second lower trough, providing the minimum trend confirmation requirement of two peaks and troughs in the same direction. The return move failure formed a third lower peak.
Furthermore, despite the return-move bounce in the first half of April, the 50 DMA crossed below the 200 DMA, executing a Death Cross. This ominous name signals what traders think this phenomenon does to investors, as prices continue to fall.
Based on the principles of technical analysis, studying the supply-demand balance, while bulls may offer up a last, valiant fight, the price should continue to fall.
Trading Strategies - Short Position Setup
Conservative traders would wait for the price to cross below the uptrend once more, followed by posting a third trough, lower than the former March 25, $149.02. That price level may find considerable support of the same day's exceptionally bullish hammer, with a tiny head and a mile-long lower shadow; the price behavior signifies the strength bears displayed fighting the bulls back. That strength remains, as the support has been holding ever since.
Moderate traders would be happy with either a close beneath yesterday's hammer and the uptrend line or a second testing of the neckline. While the latter does not improve chances for a resumed downtrend, the entry closer to the neckline resistance offsets risk.
Aggressive traders may short now, providing they understand and accept the risk.

