It goes without saying that shareholders gain from a company’s earnings. When scandal erupts, it's understandable that investors may become wary that they stand to lose from lowered earnings. But despite Facebook's growing negative sentiment, we don't recommend to short Facebook just yet. Even as Facebook's data breach scandal grows from day to day, and with expectations that Zuckerberg will be called to testify before the US House Energy and Commerce Committee, nothing has changed fundamentally for the company.
Facebook's only potential competitor is Google (NASDAQ:GOOGL), and if regulators will clamp down on Facebook (NASDAQ:FB), they will do the same with Google. Facebook currently has a third more users than Google owned YouTube at 2.2 billion monthly active users compared to YouTube's 1.5 billion. This means that advertisers simply have no choice but to do business with the single largest social media company in the world.

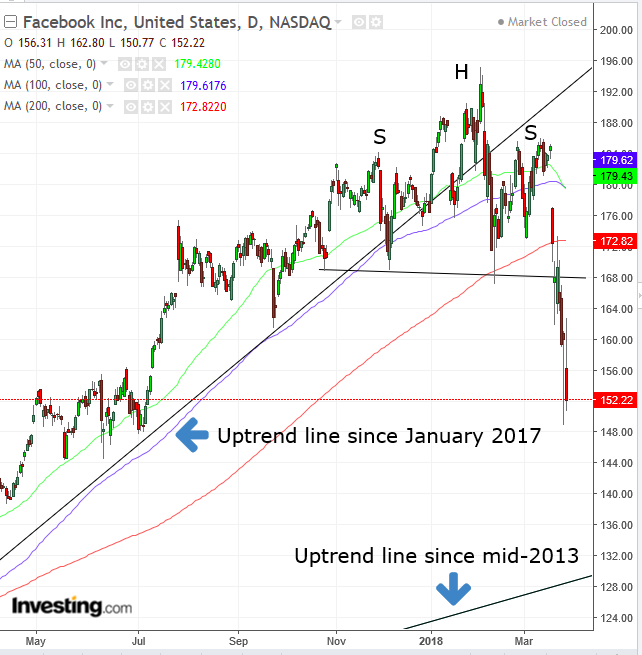
From a technical perspective, Facebook topped out but also already dropped a good way toward the top’s implied minimum target, while also still being in a long-term uptrend.
Therefore, traders should either wait for a deeper plunge to buy the distressed stock when it reaches its long-term uptrend line or wait for a potential return move, to short the stock on the upward correction.
After FB’s initial fall from its $38 IPO on May 21, 2012, losing more than half its value in under 14 weeks, down to a $17.55 low on September 3, Facebook has been in an uptrend.
The stock completed a H&S top, spanning 5 months, since October, crossing below the neckline last week and extending the breakout this week.
The price fell through the uptrend line since January 2017, the 50, 100 and 200 dma. Also, the 50 dma (green) crossed below the 100 dma (blue) yesterday, executing a Death Cross. The ominous name projects the negative sentiment associated with the technical event, seen as a reversal in momentum from up to down.
As bearish as all this sounds, the $19 drop from the neckline means a sizable portion of the $27 implied move toward the $141 target – based on the pattern’s height – has been established. This increases the risk for a pullback, in the form of a return move to retest the market’s bearishness, manifested by the neckline.
It is also noteworthy to remember that the long-term uptrend since 2013 is still intact. Therefore, bulls would do well to wait for a deeper dip, toward the main uptrend line, in the mid-$130’s and bears should be patient for a potential return move to short closer to the $168 neckline.
