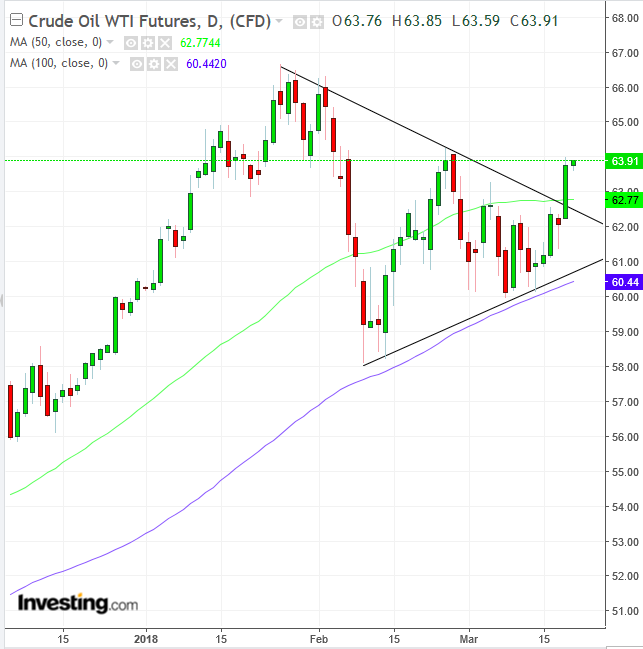
More than three weeks ago, the price of WTI crude jumped higher. Today, it extended its advance and is about to scale higher than the February 26, $64.24 peak.
There are a few fundamental drivers pushing oil higher – perhaps as high as $70.
The first is rising tensions between Saudi Arabia and Iran. Oil prices rose this past Friday on a statement by Saudi Arabian Crown Prince Mohammed bin Salman that Saudi Arabia would develop nuclear weapons if Iran did as well.
Yesterday the Saudi Arabian Crown Prince arrived in Washington for a state visit. Crown Prince Mohammed bin Salman has a clear agenda to increase pressure on Iran. This leads to the second fundamental driver of oil, namely economic sanctions against Iran which would have a serious effect on the country's oil dominated economy. The Crown Prince's presence in Washington raises suspicion regarding the rising potential that President Trump will refuse to sign a waver to extend Iran's nuclear deal, in effect reinstating US sanctions on Iran. This obviously has which would have serious implications on the price of oil.
The last main fundamental event driving oil higher is continued Venezuelan supply interruption. According to last week's IEA report, February's output was already down by more than half a million barrels compared to a year ago.
On the other side of this table, sits significant bearish factor—US domestic shale production, which is ready to gear up at any time as oil prices continue higher.

Both sides of this equation can be seen in the chart, in the form of a symmetrical triangle, as each side inches closer to the middle, absorbing the other side’s supply and demand.
However, yesterday's breakout on the upside demonstrates that there was more demand than supply. Therefore, the prevailing demand was forced to go outside of the range to seek new supply at higher ground. This breakout is expected to trigger a domino effect, which includes practical short covering and a reversal in sentiment, which will keep boosting prices upward.
The same dynamic between supply and demand that occurred inside the range is expected to repeat itself on the upside, eyeing the $70 level. Not just that, but it's expected that level will be reached in under two months, which is the same duration as the triangle’s development.
Trading Strategies – Long Position Setup
Conservative traders would wait for a 3 percent penetration from the $62.60 breakout to $64.50, a conservative filter, to weed out bull traps. Then, they would wait for a likely return move which will be stopped by overwhelming demand as it nears the pattern, to evidence that the right dynamic is in play.
Moderate traders’ 2 percent filter has already been activated. They might wait for a return move for a better entry, but not necessarily for proof of demand.
Aggressive traders may enter a long position immediately, providing they can afford a meaningful stop-loss, preferably beneath the triangle top, or at least the $62.77 50 dma (green), or the risk to their capital.
